Cheesecake Factory Investor Presentation Deck
Diversified Growth Engines Expected to
Drive 7% Unit Growth Annually
Diversified multi-
concept across
segment,
price point,
occasion,
real estate and
labor
Leveraging brand
power, operational
excellence, scale,
supply chain and
real estate
development
expertise
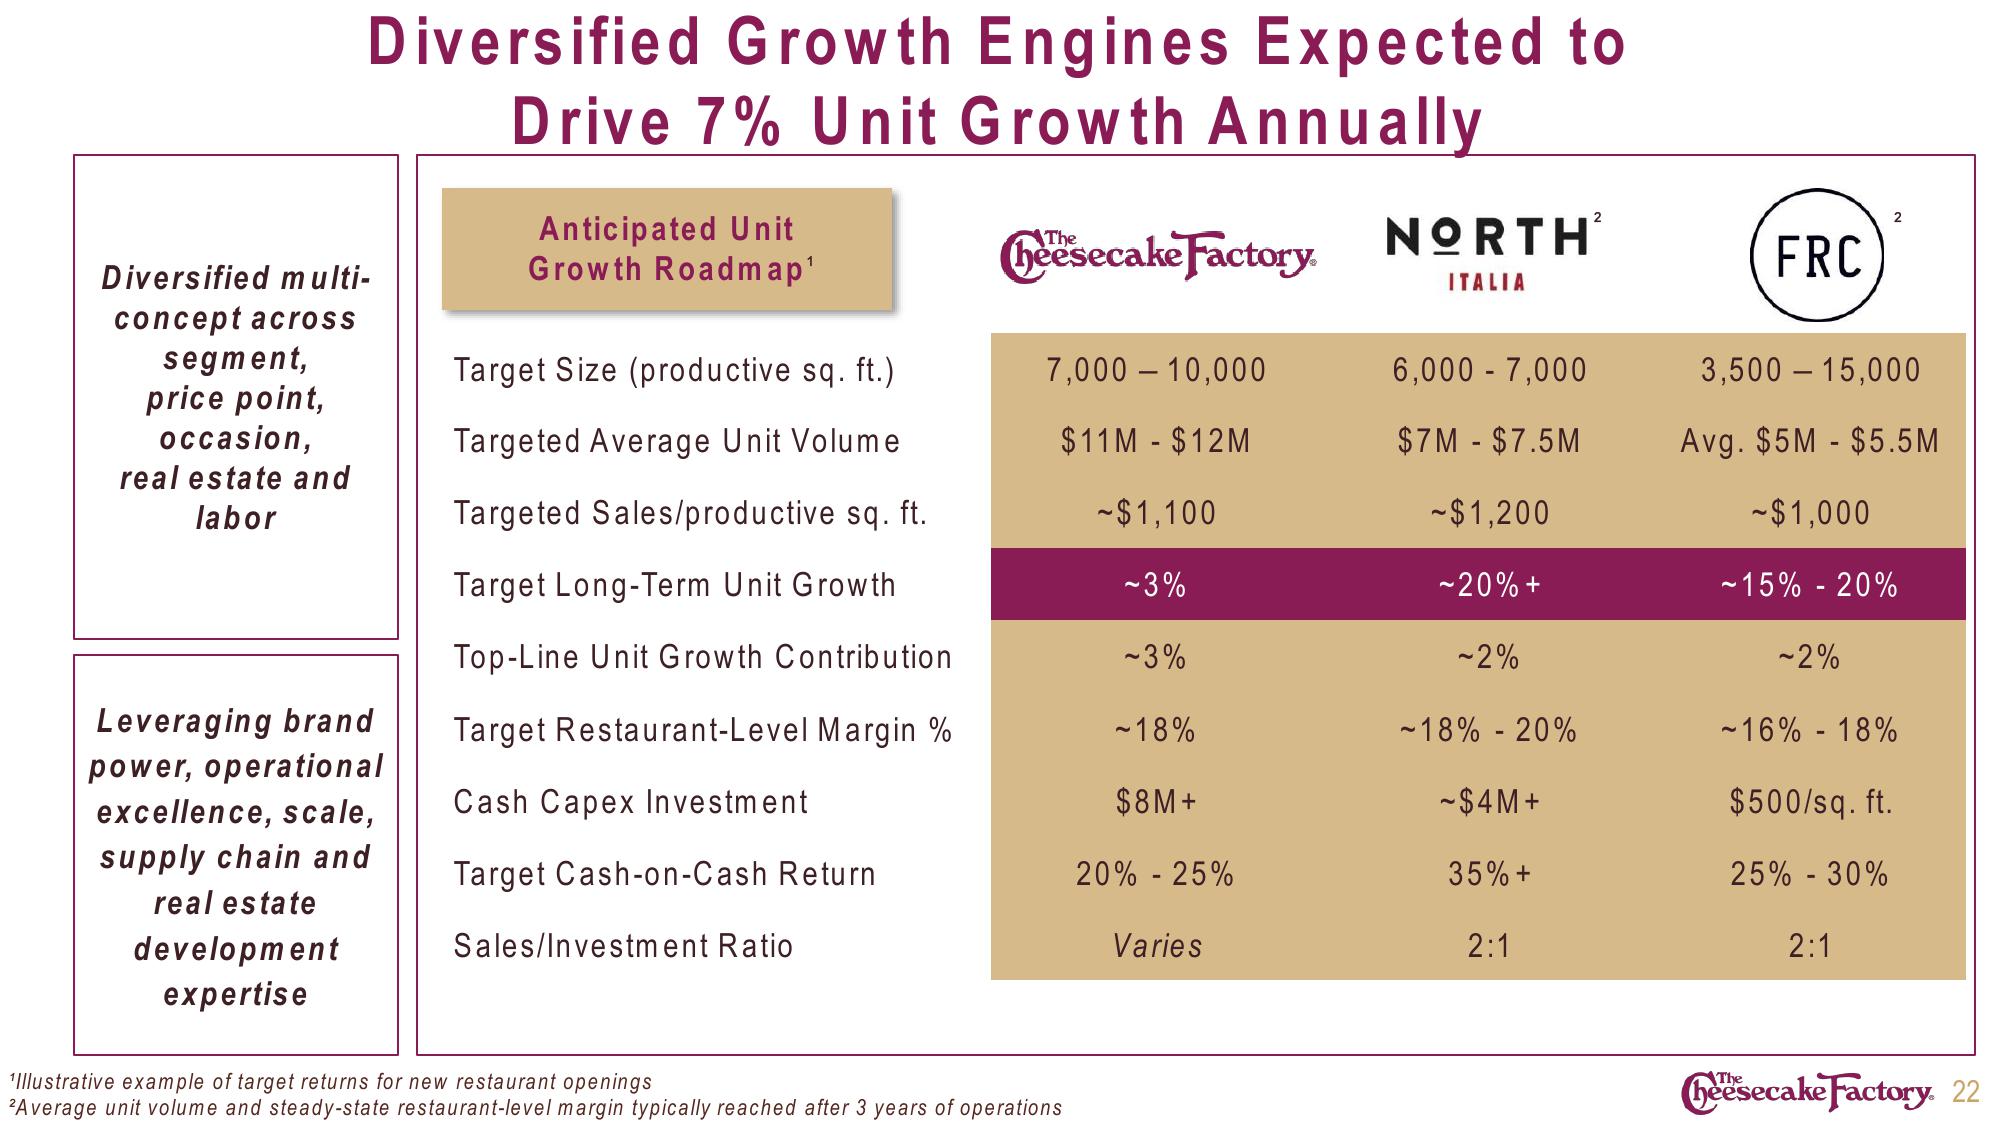
Anticipated Unit
Growth Roadmap¹
Target Size (productive sq. ft.)
Targeted Average Unit Volume
Targeted Sales/productive sq. ft.
Target Long-Term Unit Growth
Top-Line Unit Growth Contribution
Target Restaurant-Level Margin %
Cash Capex Investment
Target Cash-on-Cash Return
Sales/Investment Ratio
heesecake Factory.
7,000 - 10,000
$11M - $12M
~$1,100
~3%
'Illustrative example of target returns for new restaurant openings
²Average unit volume and steady-state restaurant-level margin typically reached after 3 years of operations
-3%
~ 18%
$8M+
20% - 25%
Varies
NORTH
ITALIA
6,000 - 7,000
$7M - $7.5M
- $1,200
~20% +
~2%
-18% - 20%
~$4M+
35% +
2:1
FRC
2
3,500 - 15,000
Avg. $5M - $5.5M
~$1,000
-15% - 20%
~2%
-16% - 18%
$500/sq. ft.
25% - 30%
2:1
Cheesecake Factory. 22View entire presentation