TPG Results Presentation Deck
GAAP Statements of Operations (Unaudited)
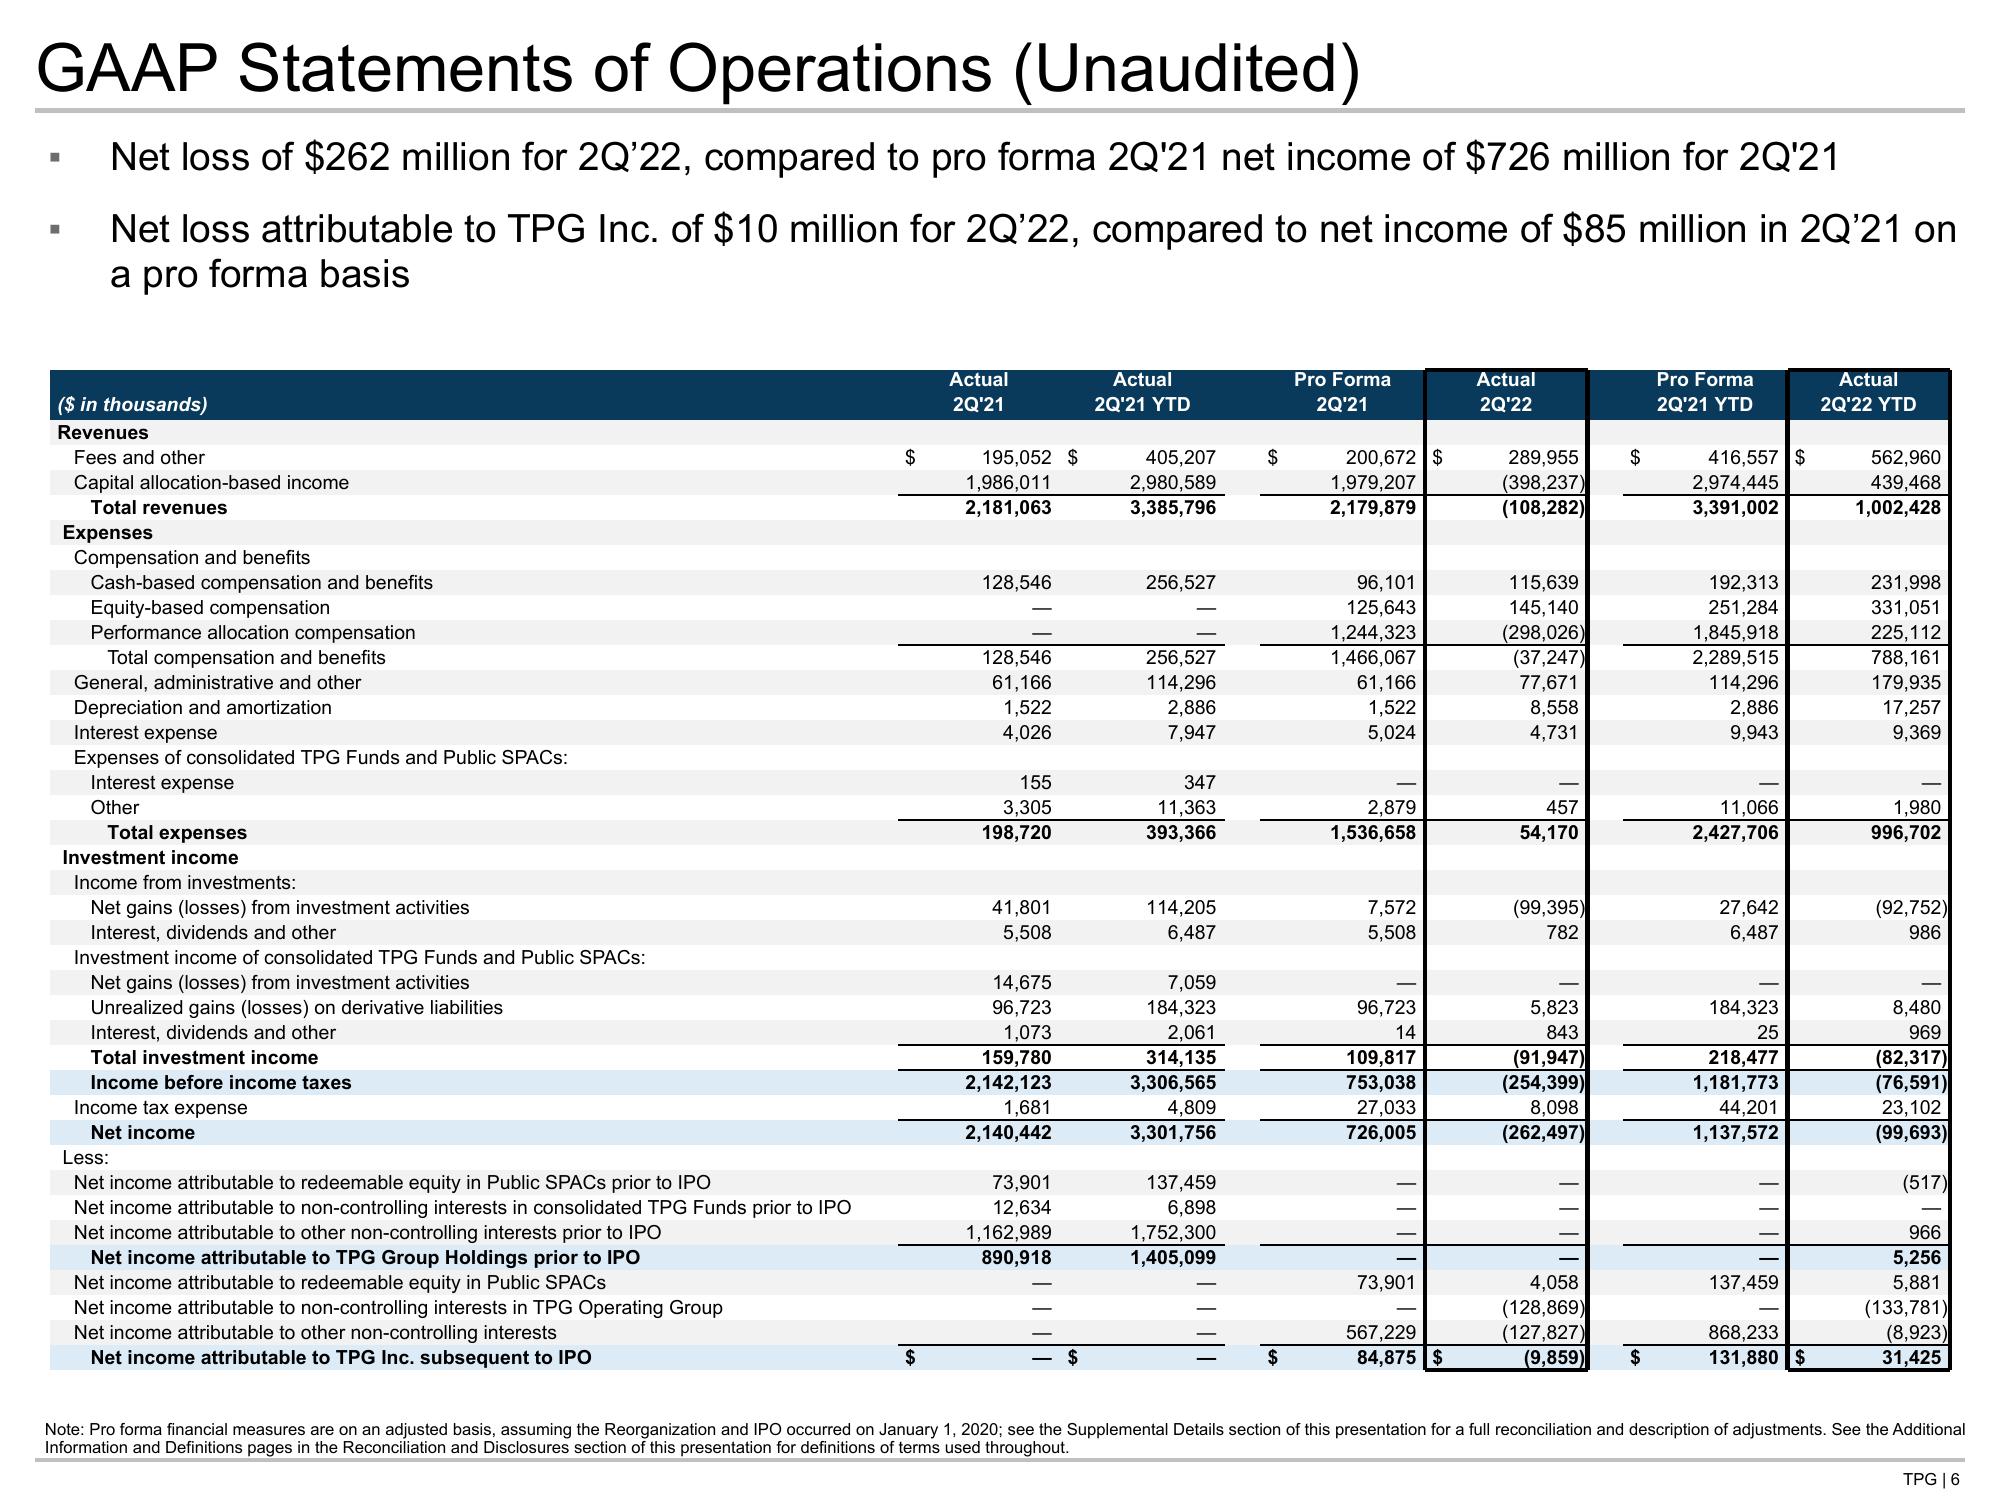
Net loss of $262 million for 2Q'22, compared to pro forma 2Q'21 net income of $726 million for 2Q'21
Net loss attributable to TPG Inc. of $10 million for 2Q'22, compared to net income of $85 million in 2Q'21 on
a pro forma basis
■
■
($ in thousands)
Revenues
Fees and other
Capital allocation-based income
Total revenues
Expenses
Compensation and benefits
Cash-based compensation and benefits
Equity-based compensation
Performance allocation compensation
Total compensation and benefits
General, administrative and other
Depreciation and amortization
Interest expense
Expenses of consolidated TPG Funds and Public SPACs:
Interest expense
Other
Total expenses
Investment income
Income from investments:
Net gains (losses) from investment activities
Interest, dividends and other
Investment income of consolidated TPG Funds and Public SPACs:
Net gains (losses) from investment activities
Unrealized gains (losses) on derivative liabilities
Interest, dividends and other
Total investment income
Income before income taxes
Income tax expense
Net income
Less:
Net income attributable to redeemable equity in Public SPACs prior to IPO
Net income attributable to non-controlling interests in consolidated TPG Funds prior to IPO
Net income attributable to other non-controlling interests prior to IPO
Net income attributable to TPG Group Holdings prior to IPO
Net income attributable to redeemable equity in Public SPACS
Net income attributable to non-controlling interests in TPG Operating Group
Net income attributable to other non-controlling interests
Net income attributable to TPG Inc. subsequent to IPO
$
$
Actual
2Q'21
195,052 $
1,986,011
2,181,063
128,546
128,546
61,166
1,522
4,026
155
3,305
198,720
41,801
5,508
14,675
96,723
1,073
159,780
2,142,123
1,681
2,140,442
73,901
12,634
1,162,989
890,918
Actual
2Q'21 YTD
405,207
2,980,589
3,385,796
256,527
256,527
114,296
2,886
7,947
347
11,363
393,366
114,205
6,487
7,059
184,323
2,061
314,135
3,306,565
4,809
3,301,756
137,459
6,898
1,752,300
1,405,099
$
Pro Forma
2Q'21
200,672 $
1,979,207
2,179,879
96,101
125,643
1,244,323
1,466,067
61,166
1,522
5,024
2,879
1,536,658
7,572
5,508
96,723
14
109,817
753,038
27,033
726,005
73,901
567,229
84,875 $
Actual
2Q'22
289,955
(398,237)
(108,282)
115,639
145, 140
(298,026)
(37,247)
77,671
8,558
4,731
457
54,170
(99,395)
782
5,823
843
(91,947)
(254,399)
8,098
(262,497)
$
4,058
(128,869)
(127,827)
(9,859) $
Pro Forma
2Q'21 YTD
416,557 $
2,974,445
3,391,002
192,313
251,284
1,845,918
2,289,515
114,296
2,886
9,943
11,066
2,427,706
27,642
6,487
184,323
25
218,477
1,181,773
44,201
1,137,572
137,459
868,233
131,880 $
Actual
2Q'22 YTD
562,960
439,468
1,002,428
231,998
331,051
225,112
788,161
179,935
17,257
9,369
1,980
996,702
(92,752)
986
8,480
969
(82,317)
(76,591)
23,102
(99,693)
(517)
966
5,256
5,881
(133,781)
(8,923)
31,425
Note: Pro forma financial measures are on an adjusted basis, assuming the Reorganization and IPO occurred on January 1, 2020; see the Supplemental Details section of this presentation for a full reconciliation and description of adjustments. See the Additional
Information and Definitions pages in the Reconciliation and Disclosures section of this presentation for definitions of terms used throughout.
TPG | 6View entire presentation