UBS Results Presentation Deck
Asset Management
Total revenues,
m
[
578
(13%)
Profit before tax,
m
r
174
(46%)
1Q22
502
94
1Q23
UBS Balances as of quarter-end
USDm, except where indicated
Total revenues
Net management fees
Performance fees
Credit loss expense / (release)
Operating expenses
Profit before tax
Cost / income ratio
Invested assets, bn
Net new money, bn
1Q23
502
479
23
0
408
94
81%
1,117
14
4Q22 1Q22 QoQ
495
471
24
0
372
124
578
561
11
17 (3%)
0
404
174
75% 70%
1,064 1,154
8
YoY
+1%
(13%)
+2% (15%)
+40%
+10% +1%
(24%) (46%)
+6pp +11pp
+5%
(3%)
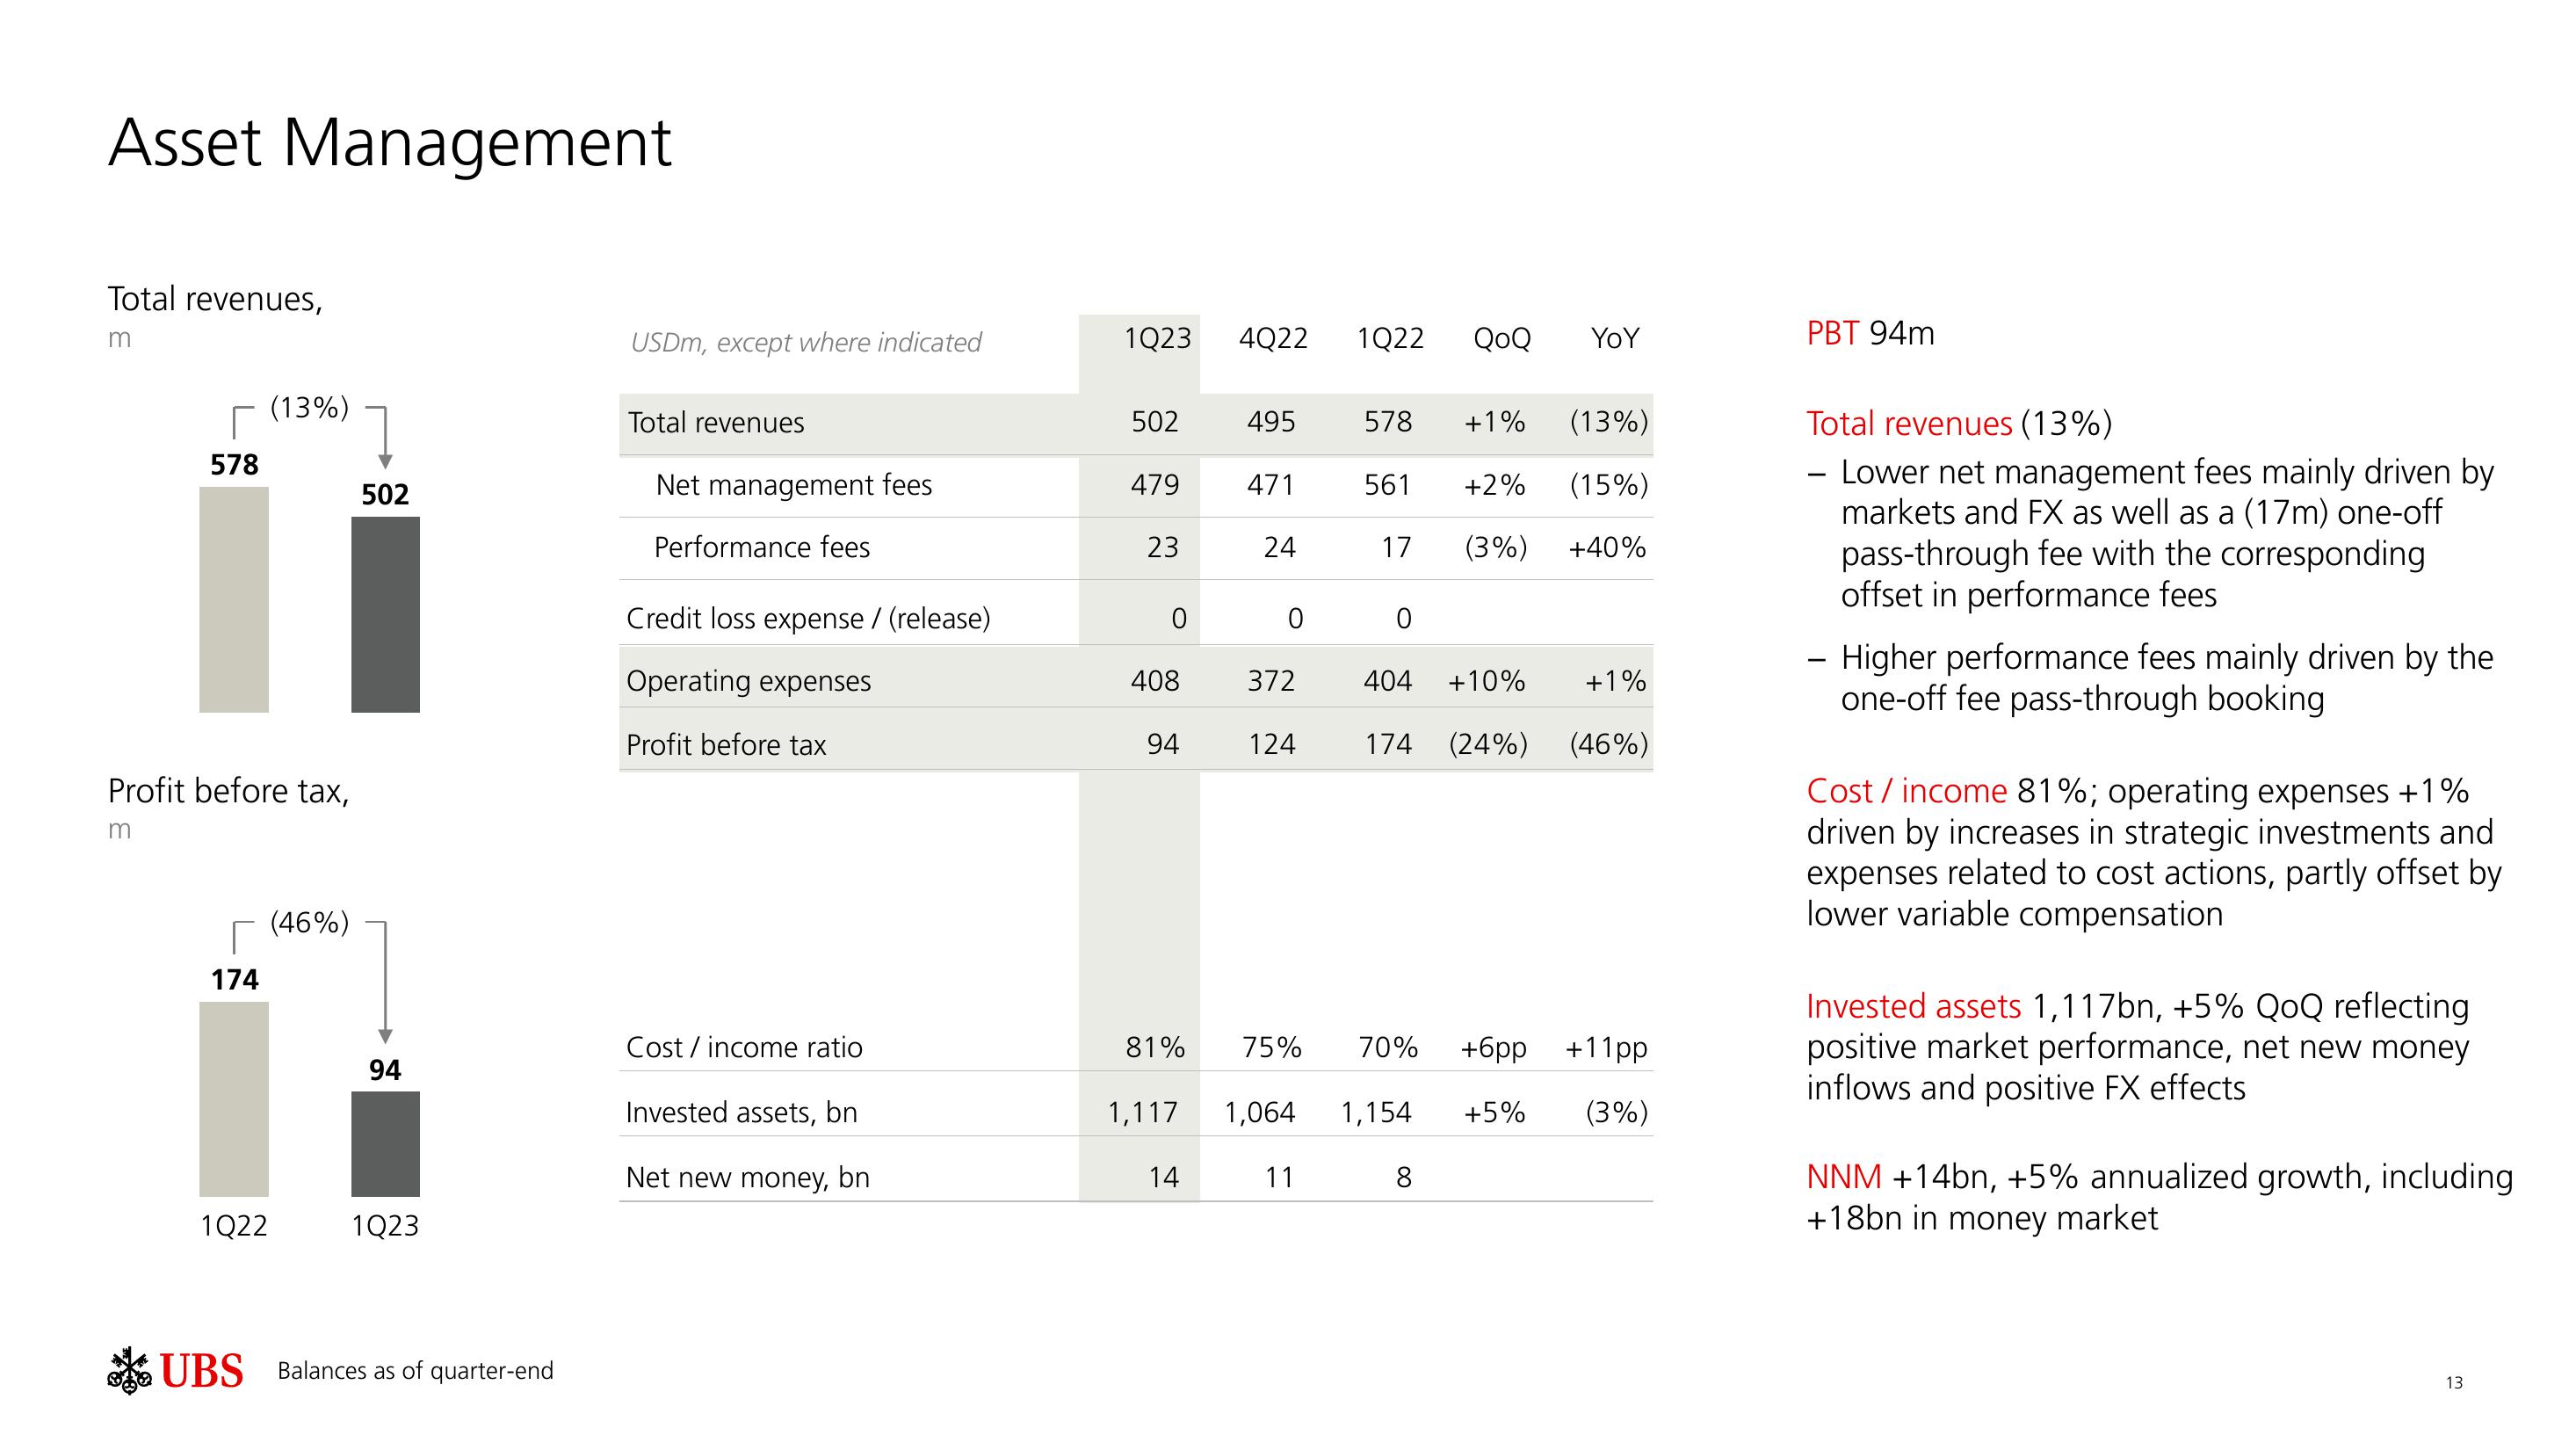
PBT 94m
Total revenues (13%)
- Lower net management fees mainly driven by
markets and FX as well as a (17m) one-off
pass-through fee with the corresponding
offset in performance fees
- Higher performance fees mainly driven by the
one-off fee pass-through booking
Cost/income 81%; operating expenses +1%
driven by increases in strategic investments and
expenses related to cost actions, partly offset by
lower variable compensation
Invested assets 1,117bn, +5% QoQ reflecting
positive market performance, net new money
inflows and positive FX effects
NNM +14bn, +5% annualized growth, including
+18bn in money market
13View entire presentation