Maersk Results Presentation Deck
A.P. Moller Maersk Group
- Interim Report 02 2015
MAERSK
DRILLING
Contents
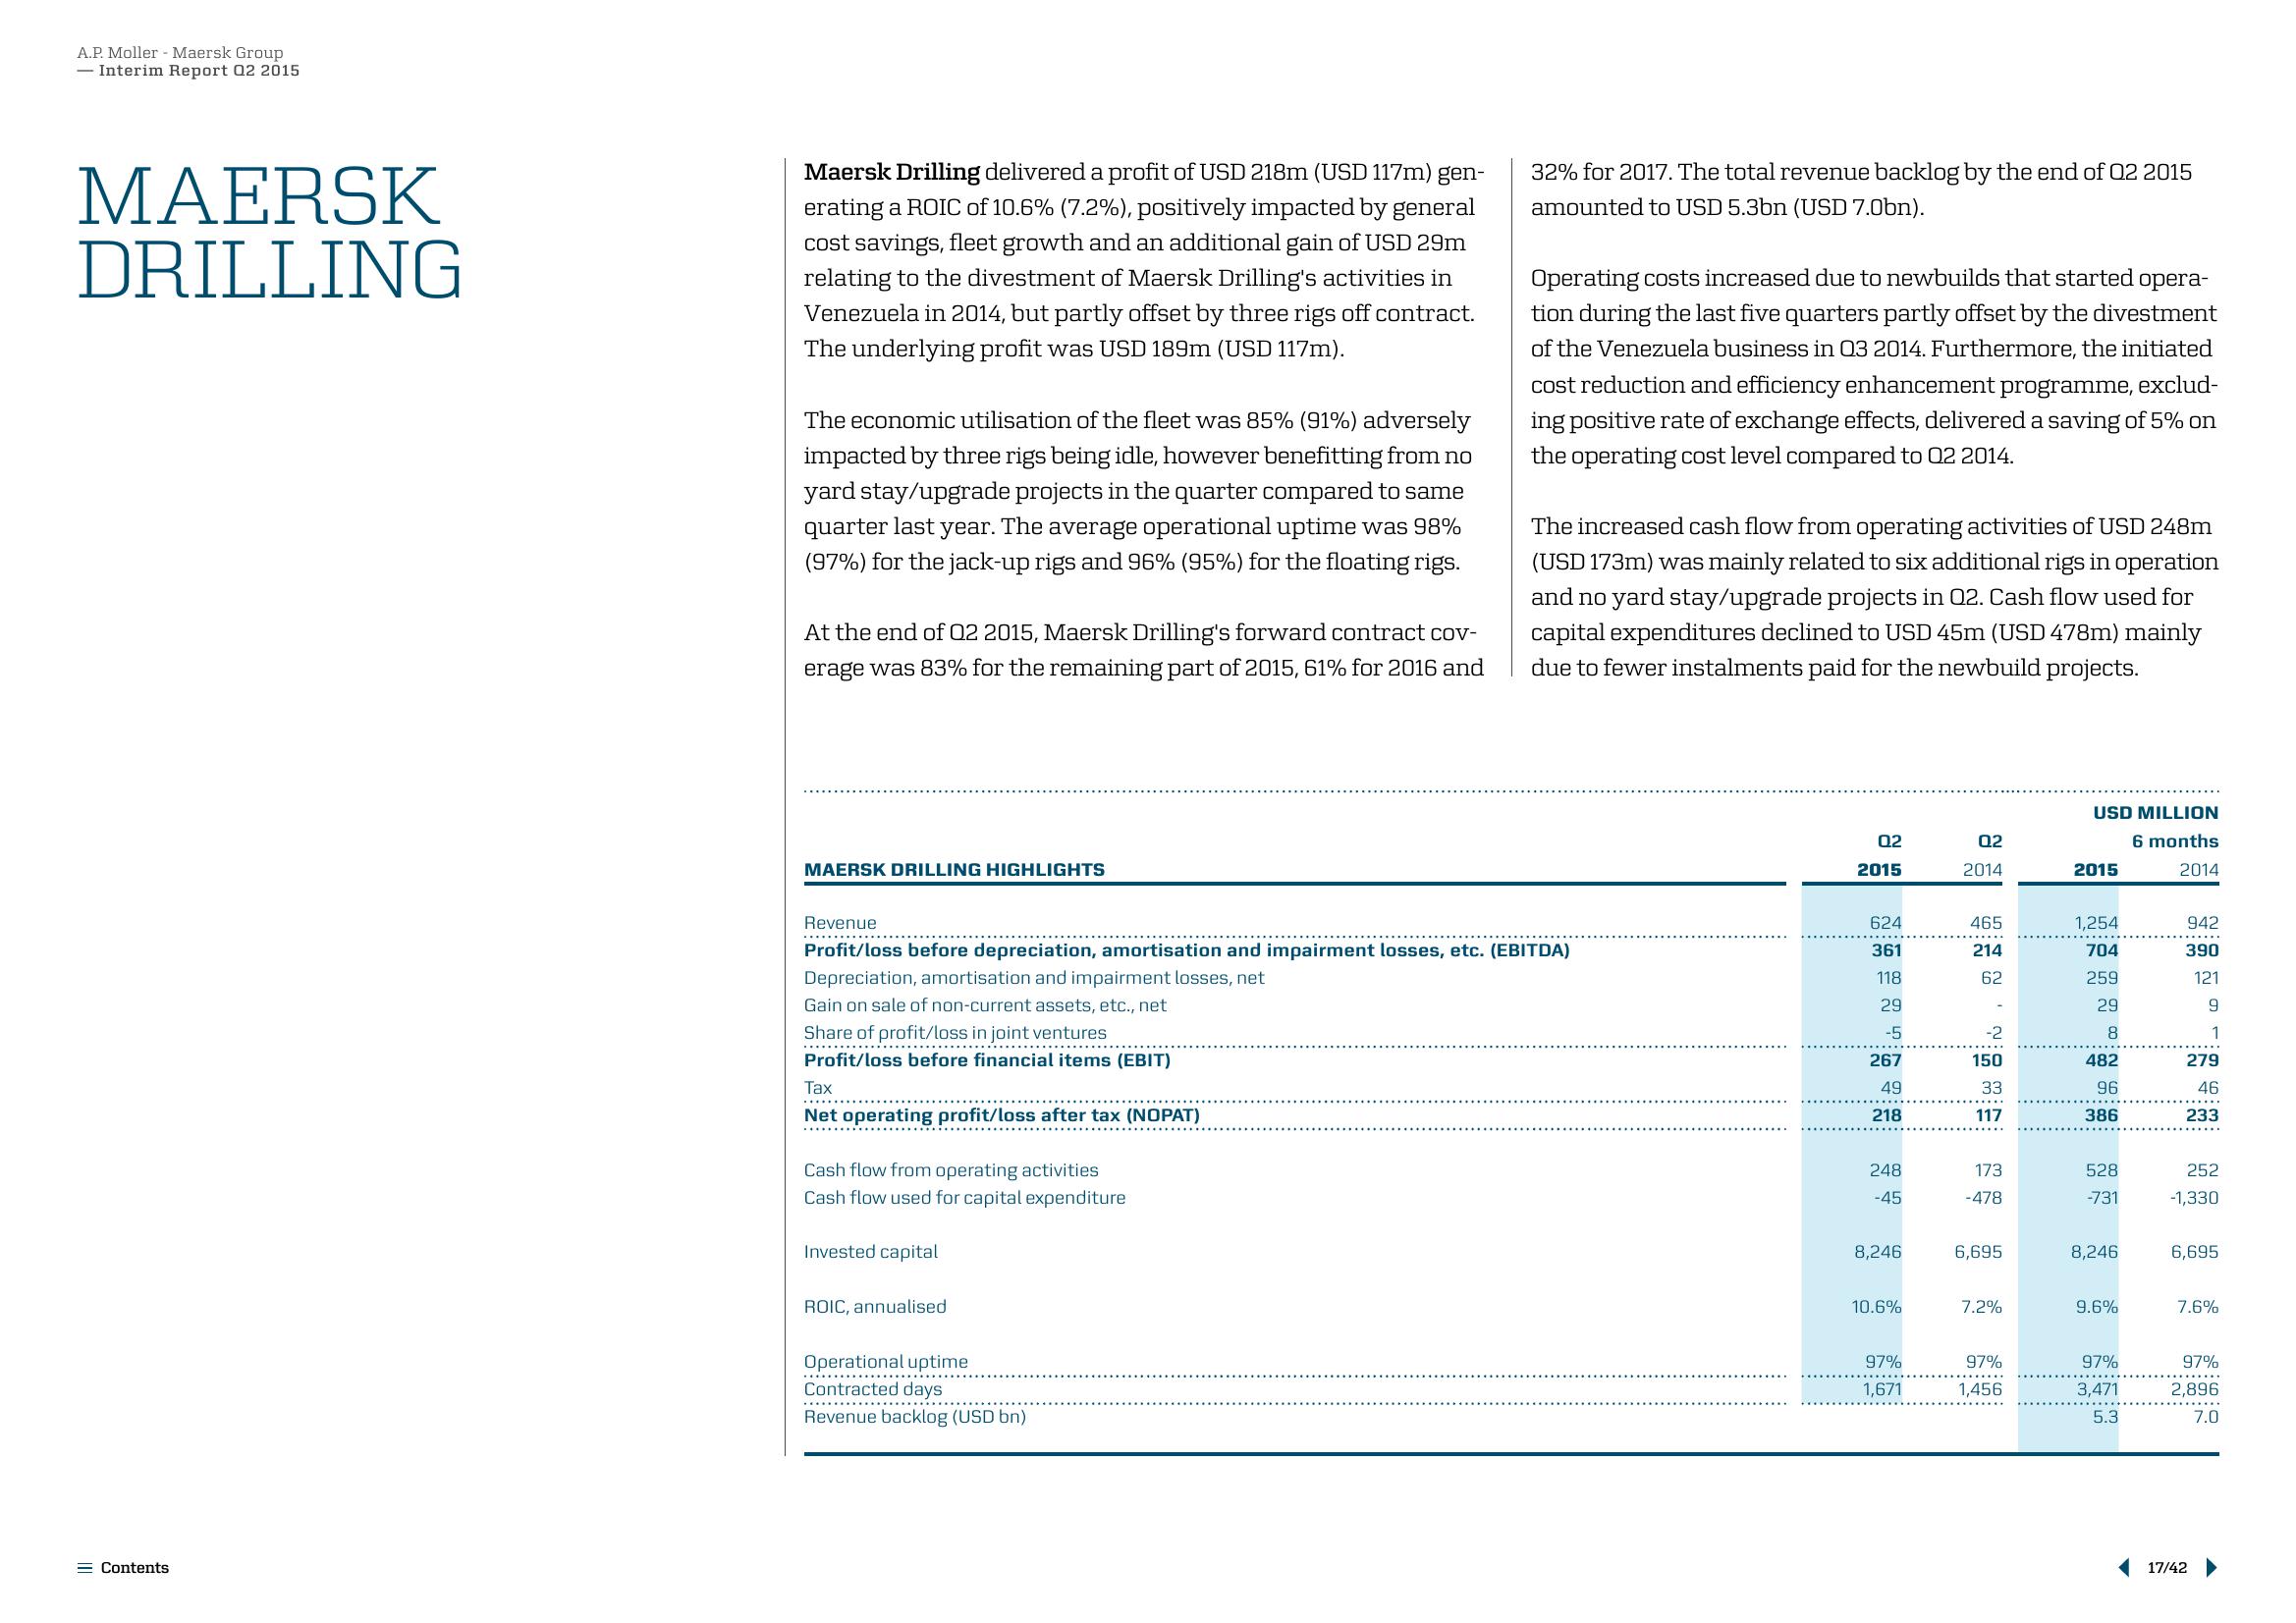
Maersk Drilling delivered a profit of USD 218m (USD 117m) gen-
erating a ROIC of 10.6% (7.2%), positively impacted by general
cost savings, fleet growth and an additional gain of USD 29m
relating to the divestment of Maersk Drilling's activities in
Venezuela in 2014, but partly offset by three rigs off contract.
The underlying profit was USD 189m (USD 117m).
The economic utilisation of the fleet was 85% (91%) adversely
impacted by three rigs being idle, however benefitting from no
yard stay/upgrade projects in the quarter compared to same
quarter last year. The average operational uptime was 98%
(97%) for the jack-up rigs and 96% (95%) for the floating rigs.
At the end of 02 2015, Maersk Drilling's forward contract cov-
erage was 83% for the remaining part of 2015, 61% for 2016 and
MAERSK DRILLING HIGHLIGHTS
Revenue
**********
Tax
Net operating profit/loss after tax (NOPAT)
Cash flow from operating activities
Cash flow used for capital expenditure
Profit/loss before depreciation, amortisation and impairment losses, etc. (EBITDA)
Depreciation, amortisation and impairment losses, net
Gain on sale of non-current assets, etc., net
Share of profit/loss in joint ventures
Profit/loss before financial items (EBIT)
Invested capital
ROIC, annualised
32% for 2017. The total revenue backlog by the end of 02 2015
amounted to USD 5.3bn (USD 7.0bn).
Operational uptime
....…....
Contracted days
Revenue backlog (USD bn)
Operating costs increased due to newbuilds that started opera-
tion during the last five quarters partly offset by the divestment
of the Venezuela business in Q3 2014. Furthermore, the initiated
cost reduction and efficiency enhancement programme, exclud-
ing positive rate of exchange effects, delivered a saving of 5% on
the operating cost level compared to 02 2014.
The increased cash flow from operating activities of USD 248m
(USD 173m) was mainly related to six additional rigs in operation
and no yard stay/upgrade projects in Q2. Cash flow used for
capital expenditures declined to USD 45m (USD 478m) mainly
due to fewer instalments paid for the newbuild projects.
02
2015
624
361
118
29
-5
267
49
218
248
-45
8,246
10.6%
97%
1,671
02
2014
465
214
62
-2
150
33
117
173
-478
6,695
7.2%
97%
1,456
USD MILLION
6 months
2014
2015
1,254
704
259
29
8
482
96
386
528
-731
8,246
9.6%
97%
3,471
5.3
942
390
121
9
1
279
46
233
252
-1,330
6,695
7.6%
97%
2,896
7.0
17/42 ▶View entire presentation