DraftKings Investor Day Presentation Deck
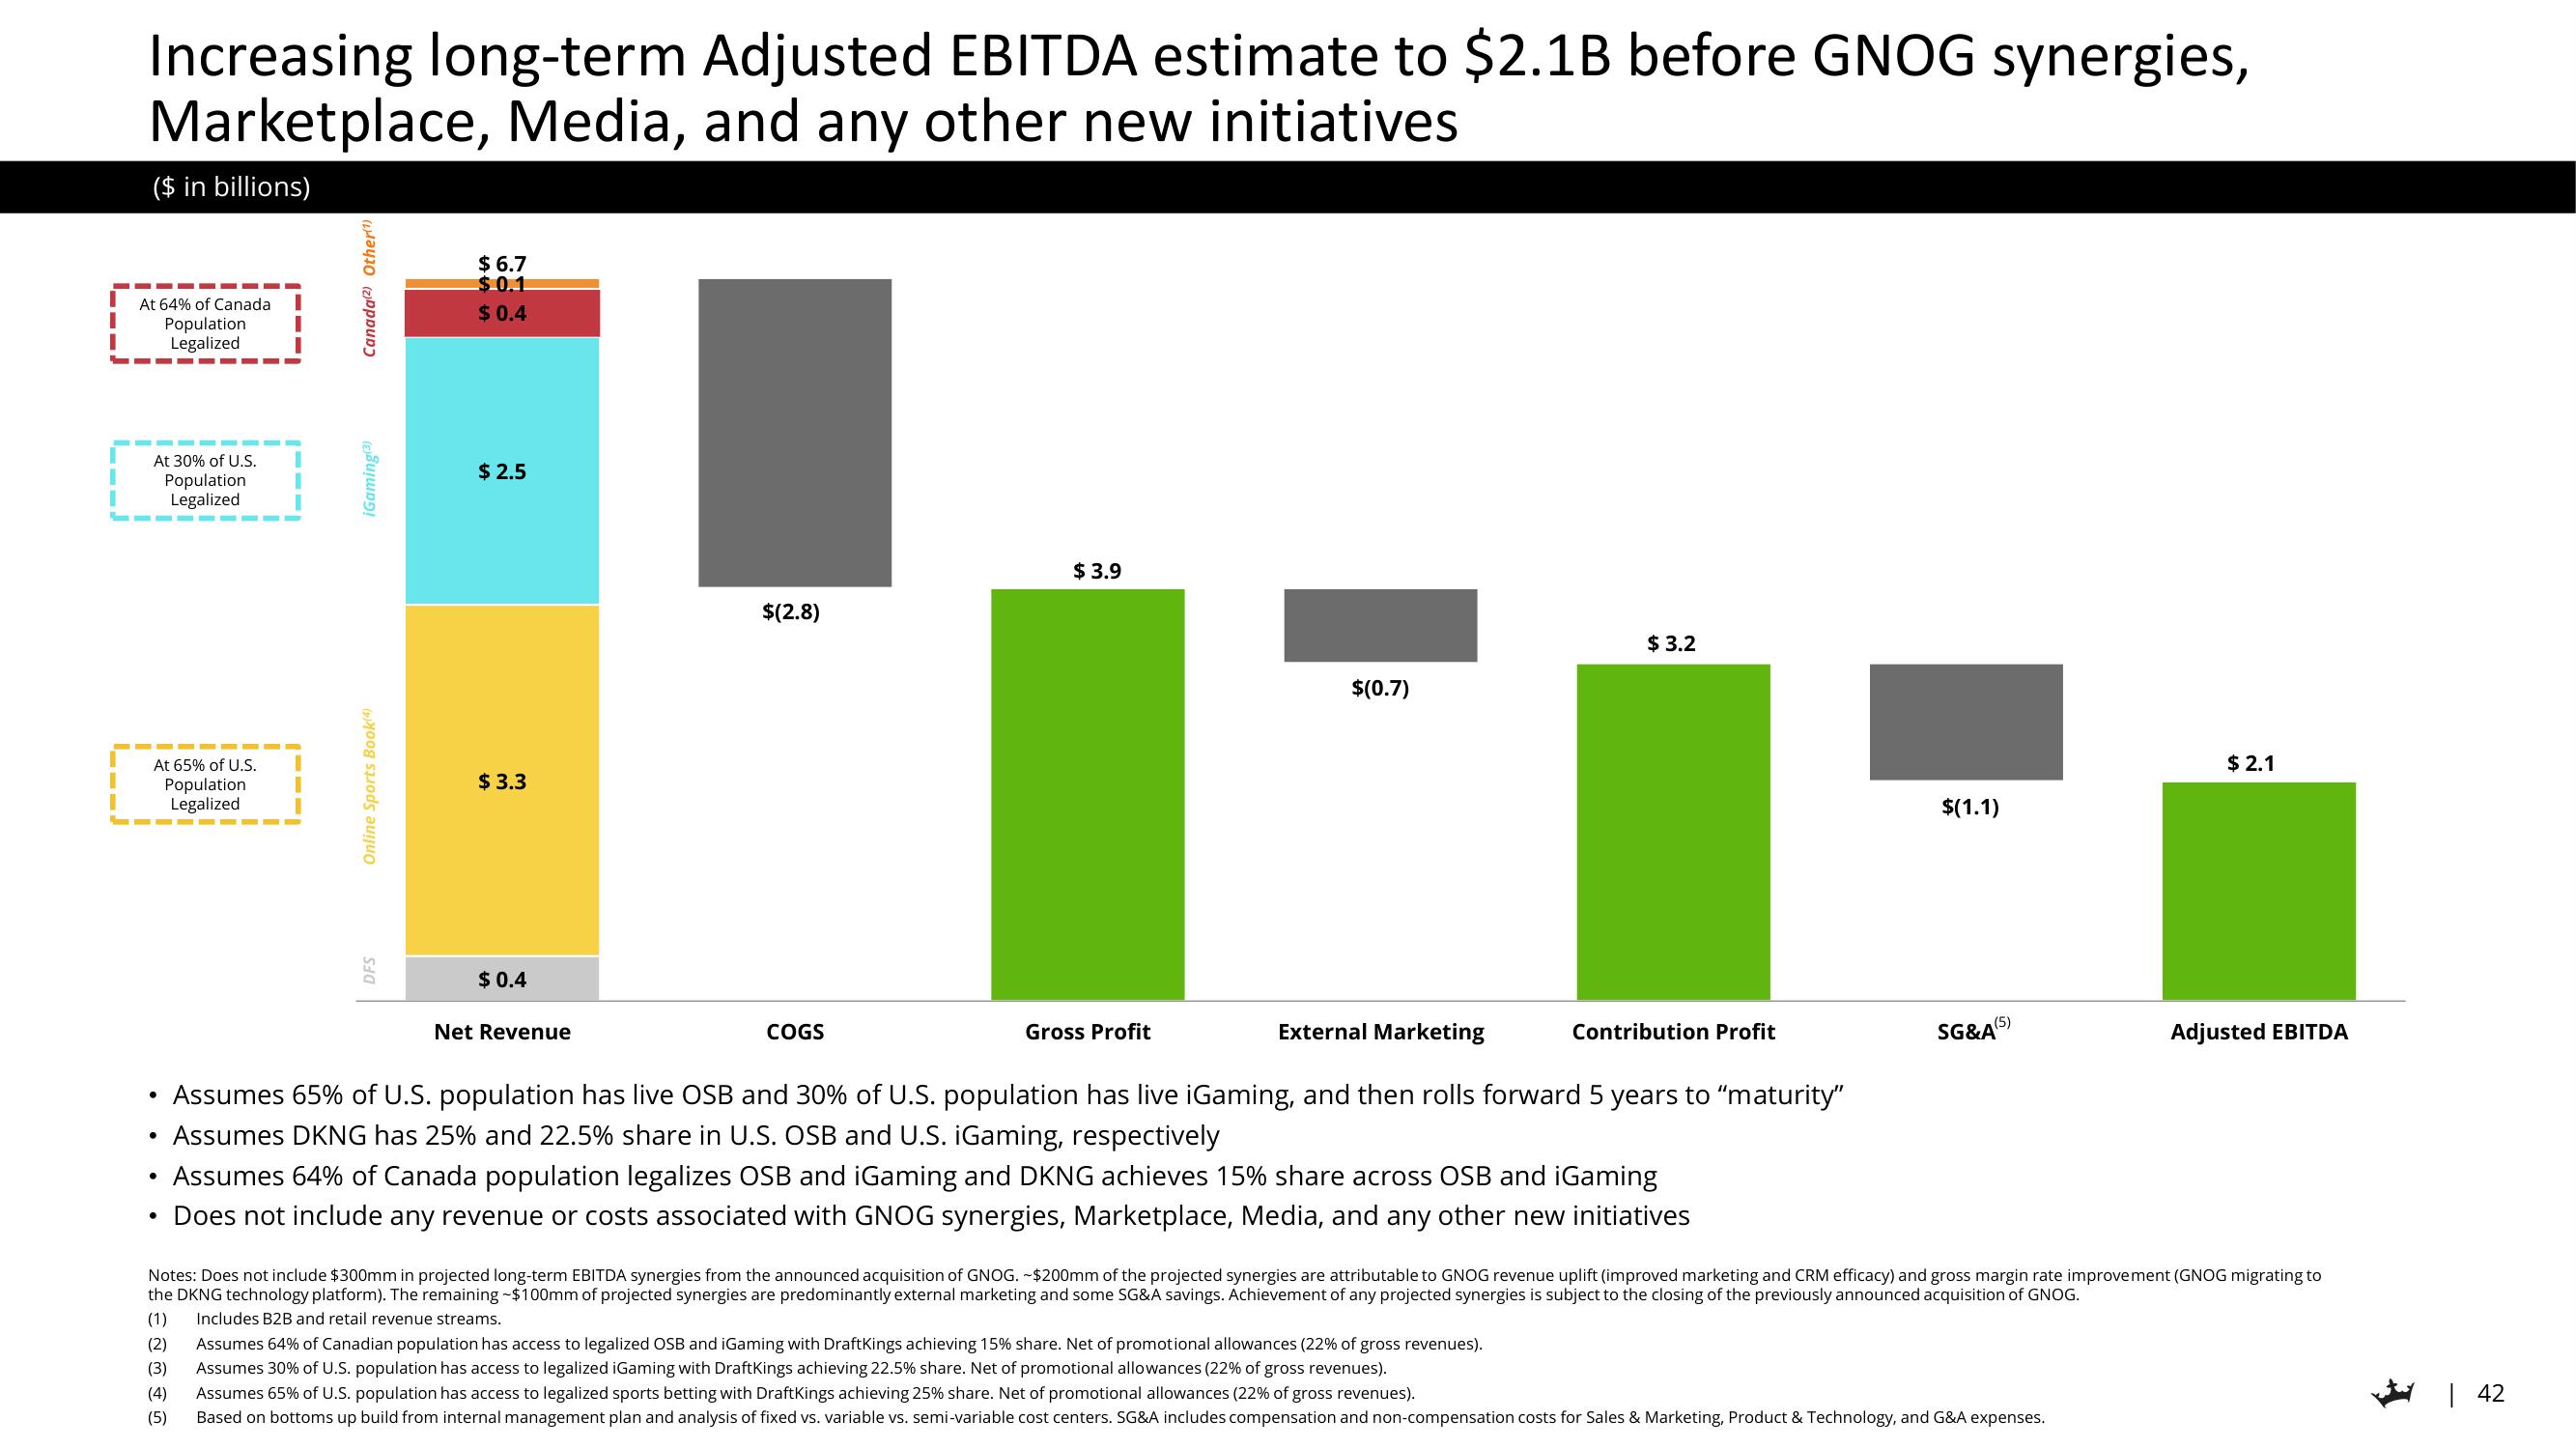
Increasing long-term Adjusted EBITDA estimate to $2.1B before GNOG synergies,
Marketplace, Media, and any other new initiatives
($ in billions)
At 64% of Canada
Population
Legalized
At 30% of U.S.
Population
Legalized
At 65% of U.S.
Population
Legalized
Canada(2) Other(¹)
●
iGaming(3)
Online Sports Book(4)
DFS
$6.7
$0.1
$ 0.4
$ 2.5
$3.3
$0.4
$(2.8)
Net Revenue
$3.9
COGS
External Marketing
Assumes 65% of U.S. population has live OSB and 30% of U.S. population has live iGaming, and then rolls forward 5 years to “maturity"
• Assumes DKNG has 25% and 22.5% share in U.S. OSB and U.S. iGaming, respectively
Assumes 64% of Canada population legalizes OSB and iGaming and DKNG achieves 15% share across OSB and iGaming
• Does not include any revenue or costs associated with GNOG synergies, Marketplace, Media, and any other new initiatives
$(0.7)
Gross Profit
$3.2
Assumes 64% of Canadian population has access to legalized OSB and iGaming with DraftKings achieving 15% share. Net of promotional allowances (22% of gross revenues).
Assumes 30% of U.S. population has access to legalized iGaming with DraftKings achieving 22.5% share. Net of promotional allowances (22% of gross revenues).
Contribution Profit
$(1.1)
SG&A(5
$ 2.1
Notes: Does not include $300mm in projected long-term EBITDA synergies from the announced acquisition of GNOG. -$200mm of the projected synergies are attributable to GNOG revenue uplift (improved marketing and CRM efficacy) and gross margin rate improvement (GNOG migrating to
the DKNG technology platform). The remaining -$100mm of projected synergies are predominantly external marketing and some SG&A savings. Achievement of any projected synergies is subject to the closing of the previously announced acquisition of GNOG.
(1) Includes B2B and retail revenue streams.
(2)
(3)
(4)
(5)
Assumes 65% of U.S. population has access to legalized sports betting with DraftKings achieving 25% share. Net of promotional allowances (22% of gross revenues).
Based on bottoms up build from internal management plan and analysis of fixed vs. variable vs. semi-variable cost centers. SG&A includes compensation and non-compensation costs for Sales & Marketing, Product & Technology, and G&A expenses.
Adjusted EBITDA
| 42View entire presentation