Snap Inc Results Presentation Deck
Capex
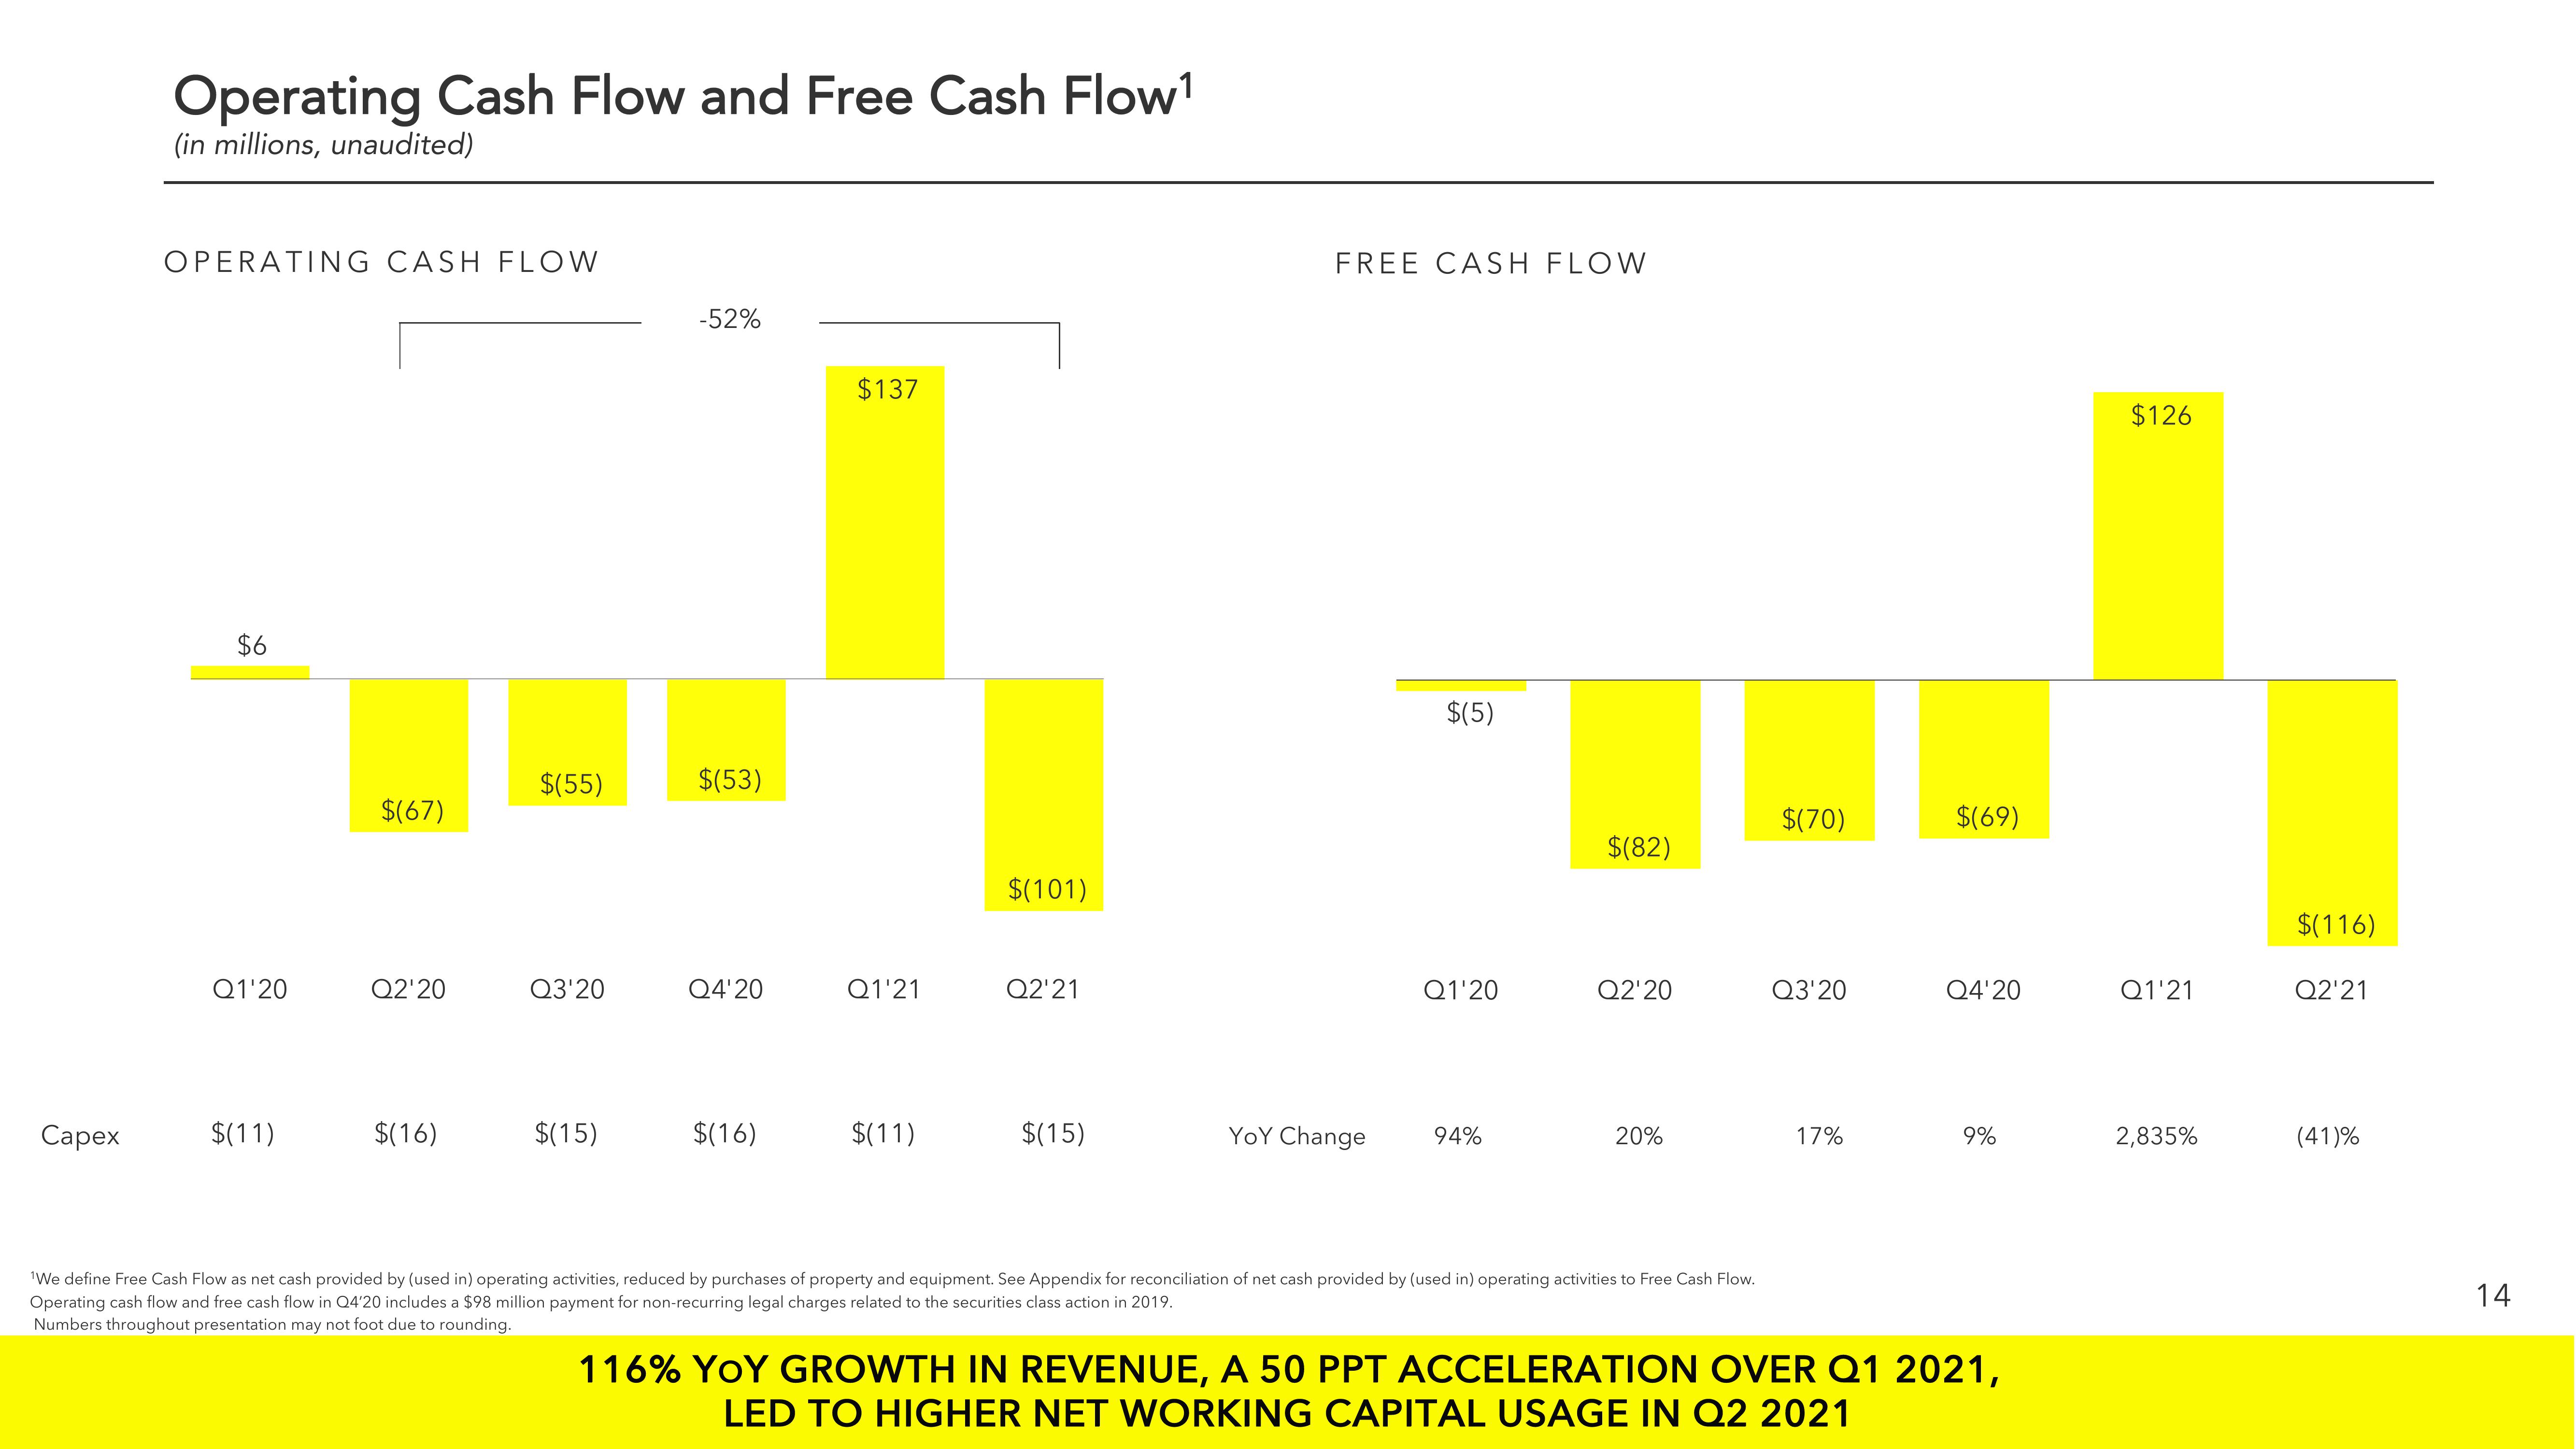
Operating Cash Flow and Free Cash Flow¹
(in millions, unaudited)
OPERATING CASH FLOW
$6
Q1'20
$(11)
$(67)
Q2'20
$(16)
$(55)
Q3'20
$(15)
-52%
$(53)
Q4'20
$(16)
$137
Q1'21
$(11)
$(101)
Q2'21
$(15)
FREE CASH FLOW
YOY Change
$(5)
Q1'20
94%
$(82)
Q2'20
20%
'We define Free Cash Flow as net cash provided by (used in) operating activities, reduced by purchases of property and equipment. See Appendix for reconciliation of net cash provided by (used in) operating activities to Free Cash Flow.
Operating cash flow and free cash flow in Q4'20 includes a $98 million payment for non-recurring legal charges related to the securities class action in 2019.
Numbers throughout presentation may not foot due to rounding.
$(70)
Q3'20
17%
$(69)
Q4'20
9%
116% YOY GROWTH IN REVENUE, A 50 PPT ACCELERATION OVER Q1 2021,
LED TO HIGHER NET WORKING CAPITAL USAGE IN Q2 2021
$126
Q1'21
2,835%
$(116)
Q2'21
(41)%
14View entire presentation