Q1 FY 2023 FINANCIAL HIGHLIGHTS
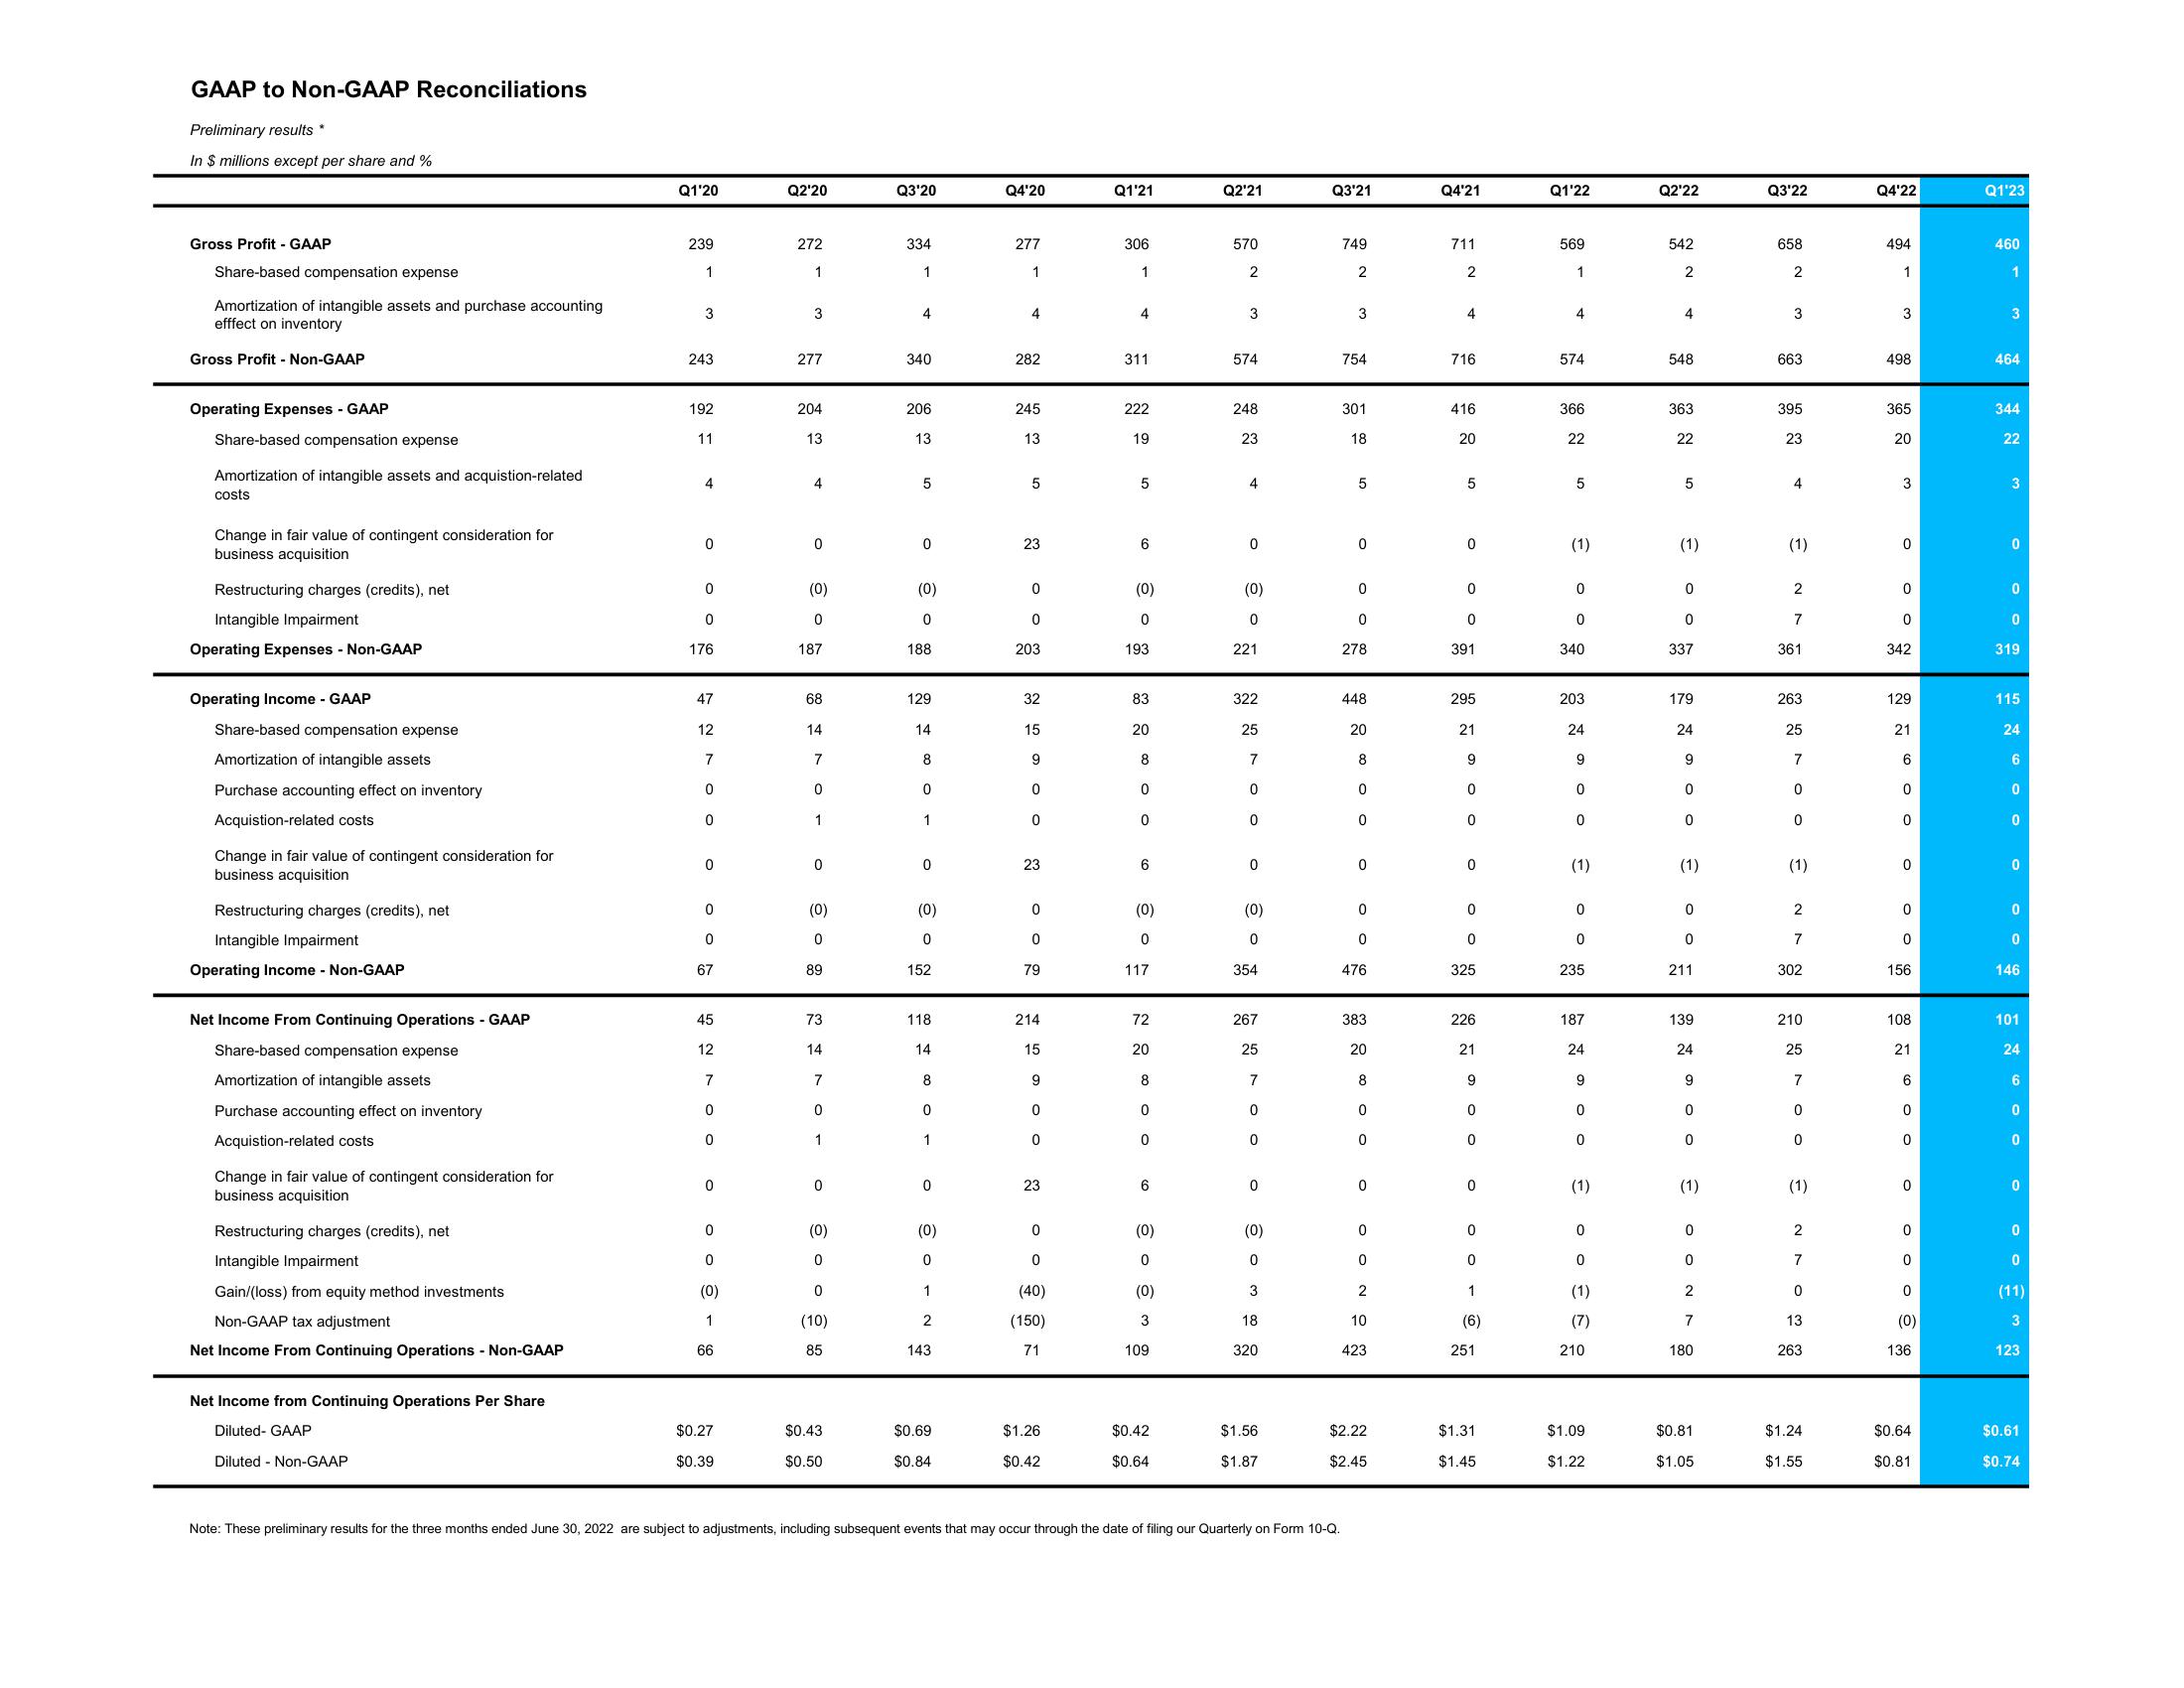
GAAP to Non-GAAP Reconciliations
Preliminary results *
In $ millions except per share and %
Gross Profit - GAAP
Share-based compensation expense
Amortization of intangible assets and purchase accounting
efffect on inventory
Gross Profit - Non-GAAP
Operating Expenses - GAAP
Share-based compensation expense
Amortization of intangible assets and acquistion-related
costs
Change in fair value of contingent consideration for
business acquisition
Restructuring charges (credits), net
Intangible Impairment
Operating Expenses - Non-GAAP
Operating Income - GAAP
Share-based compensation expense
Amortization of intangible assets
Purchase accounting effect on inventory
Acquistion-related costs
Change in fair value of contingent consideration for
business acquisition
Restructuring charges (credits), net
Intangible Impairment
Operating Income - Non-GAAP
Net Income From Continuing Operations - GAAP
Share-based compensation expense
Amortization of intangible assets
Purchase accounting effect on inventory
Acquistion-related costs
Change in fair value of contingent consideration for
business acquisition
Restructuring charges (credits), net
Intangible Impairment
Gain/(loss) from equity method investments
Non-GAAP tax adjustment
Net Income From Continuing Operations - Non-GAAP
Net Income from Continuing Operations Per Share
Diluted-GAAP
Diluted Non-GAAP
Q1'20
239
1
3
243
192
11
4
0
0
0
176
47
12
7
0
0
0
0
0
67
45
12
7
0
0
0
0
0
(0)
1
66
$0.27
$0.39
Q2'20
272
1
3
277
204
13
4
0
(0)
0
187
68
14
7
0
1
0
(0)
0
89
73
14
7
0
1
• • •
(0)
(10)
85
$0.43
$0.50
Q3'20
334
1
4
340
206
13
5
0
(0)
0
188
129
14
8
0
1
0
(0)
0
152
118
14
8
0
1
0
(0)
0
1
2
143
$0.69
$0.84
Q4'20
277
1
4
282
245
13
5
23
0
0
203
32
15
9
0
0
23
0
0
79
214
15
9
0
0
23
0
0
(40)
(150)
71
$1.26
$0.42
Q1'21
306
1
4
311.
222
19
5
6
(0)
0
193
83
20
8
0
0
6
(0)
0
117
72
20
8
0
0
6
(0)
0
(0)
3
109
$0.42
$0.64
Q2'21
570
2
3
574
248
23
4
0
(0)
0
221
322
25
7oo o
0
0
0
(0)
0
354
267
25
7
0
0
0
(0)
0
3
18
320
$1.56
$1.87
Q3'21
749
2
Note: These preliminary results for the three months ended June 30, 2022 are subject to adjustments, including subsequent events that may occur through the date of filing our Quarterly on Form 10-Q.
3
754
301
18
5
0
0
0
278
448
20
8
0
0
0
0
0
476
383
20
8
0
0
0
OONEN
0
0
2
10
423
$2.22
$2.45
Q4'21
711
2
4
716
416
20
5
0
0
0
391
295
21
9
0
0
0
0
0
325
226
21
9
0
0
0
0
0
1
(6)
251
$1.31
$1.45
Q1'22
569
1
4
574
366
22
5
(1)
0
0
340
203
24
9
0
0
(1)
0
0
235
187
24
9
0
0
(1)
• •
(1)
(7)
210
$1.09
$1.22
Q2'22
542
2
4
548
363
22
5
(1)
0
0
337
179
24
9
0
0
(1)
0
0
211
139
24
9
0
0
(1)
0
0
2
7
180
$0.81
$1.05
Q3'22
658
2
3
663
395
23
4
(1)
2
7
361
263
25
7
0
0
(1)
2
7
302
210
25
7
0
0
(1)
2
7
0
13
263
$1.24
$1.55
Q4'22
494
1
3
498
365
20
3
0
0
0
342
129
21
6
0
0
0
0
0
156
108
21
6
0
0
0
0
0
0
(0)
136
$0.64
$0.81
Q1'23
460
1
3
464
344
22
3
0
0
0
319
115
24
6
0
0
0
0
0
146
101
24
6
0
0
0
0
0
(11)
3
123
$0.61
$0.74View entire presentation