EVBox SPAC Presentation Deck
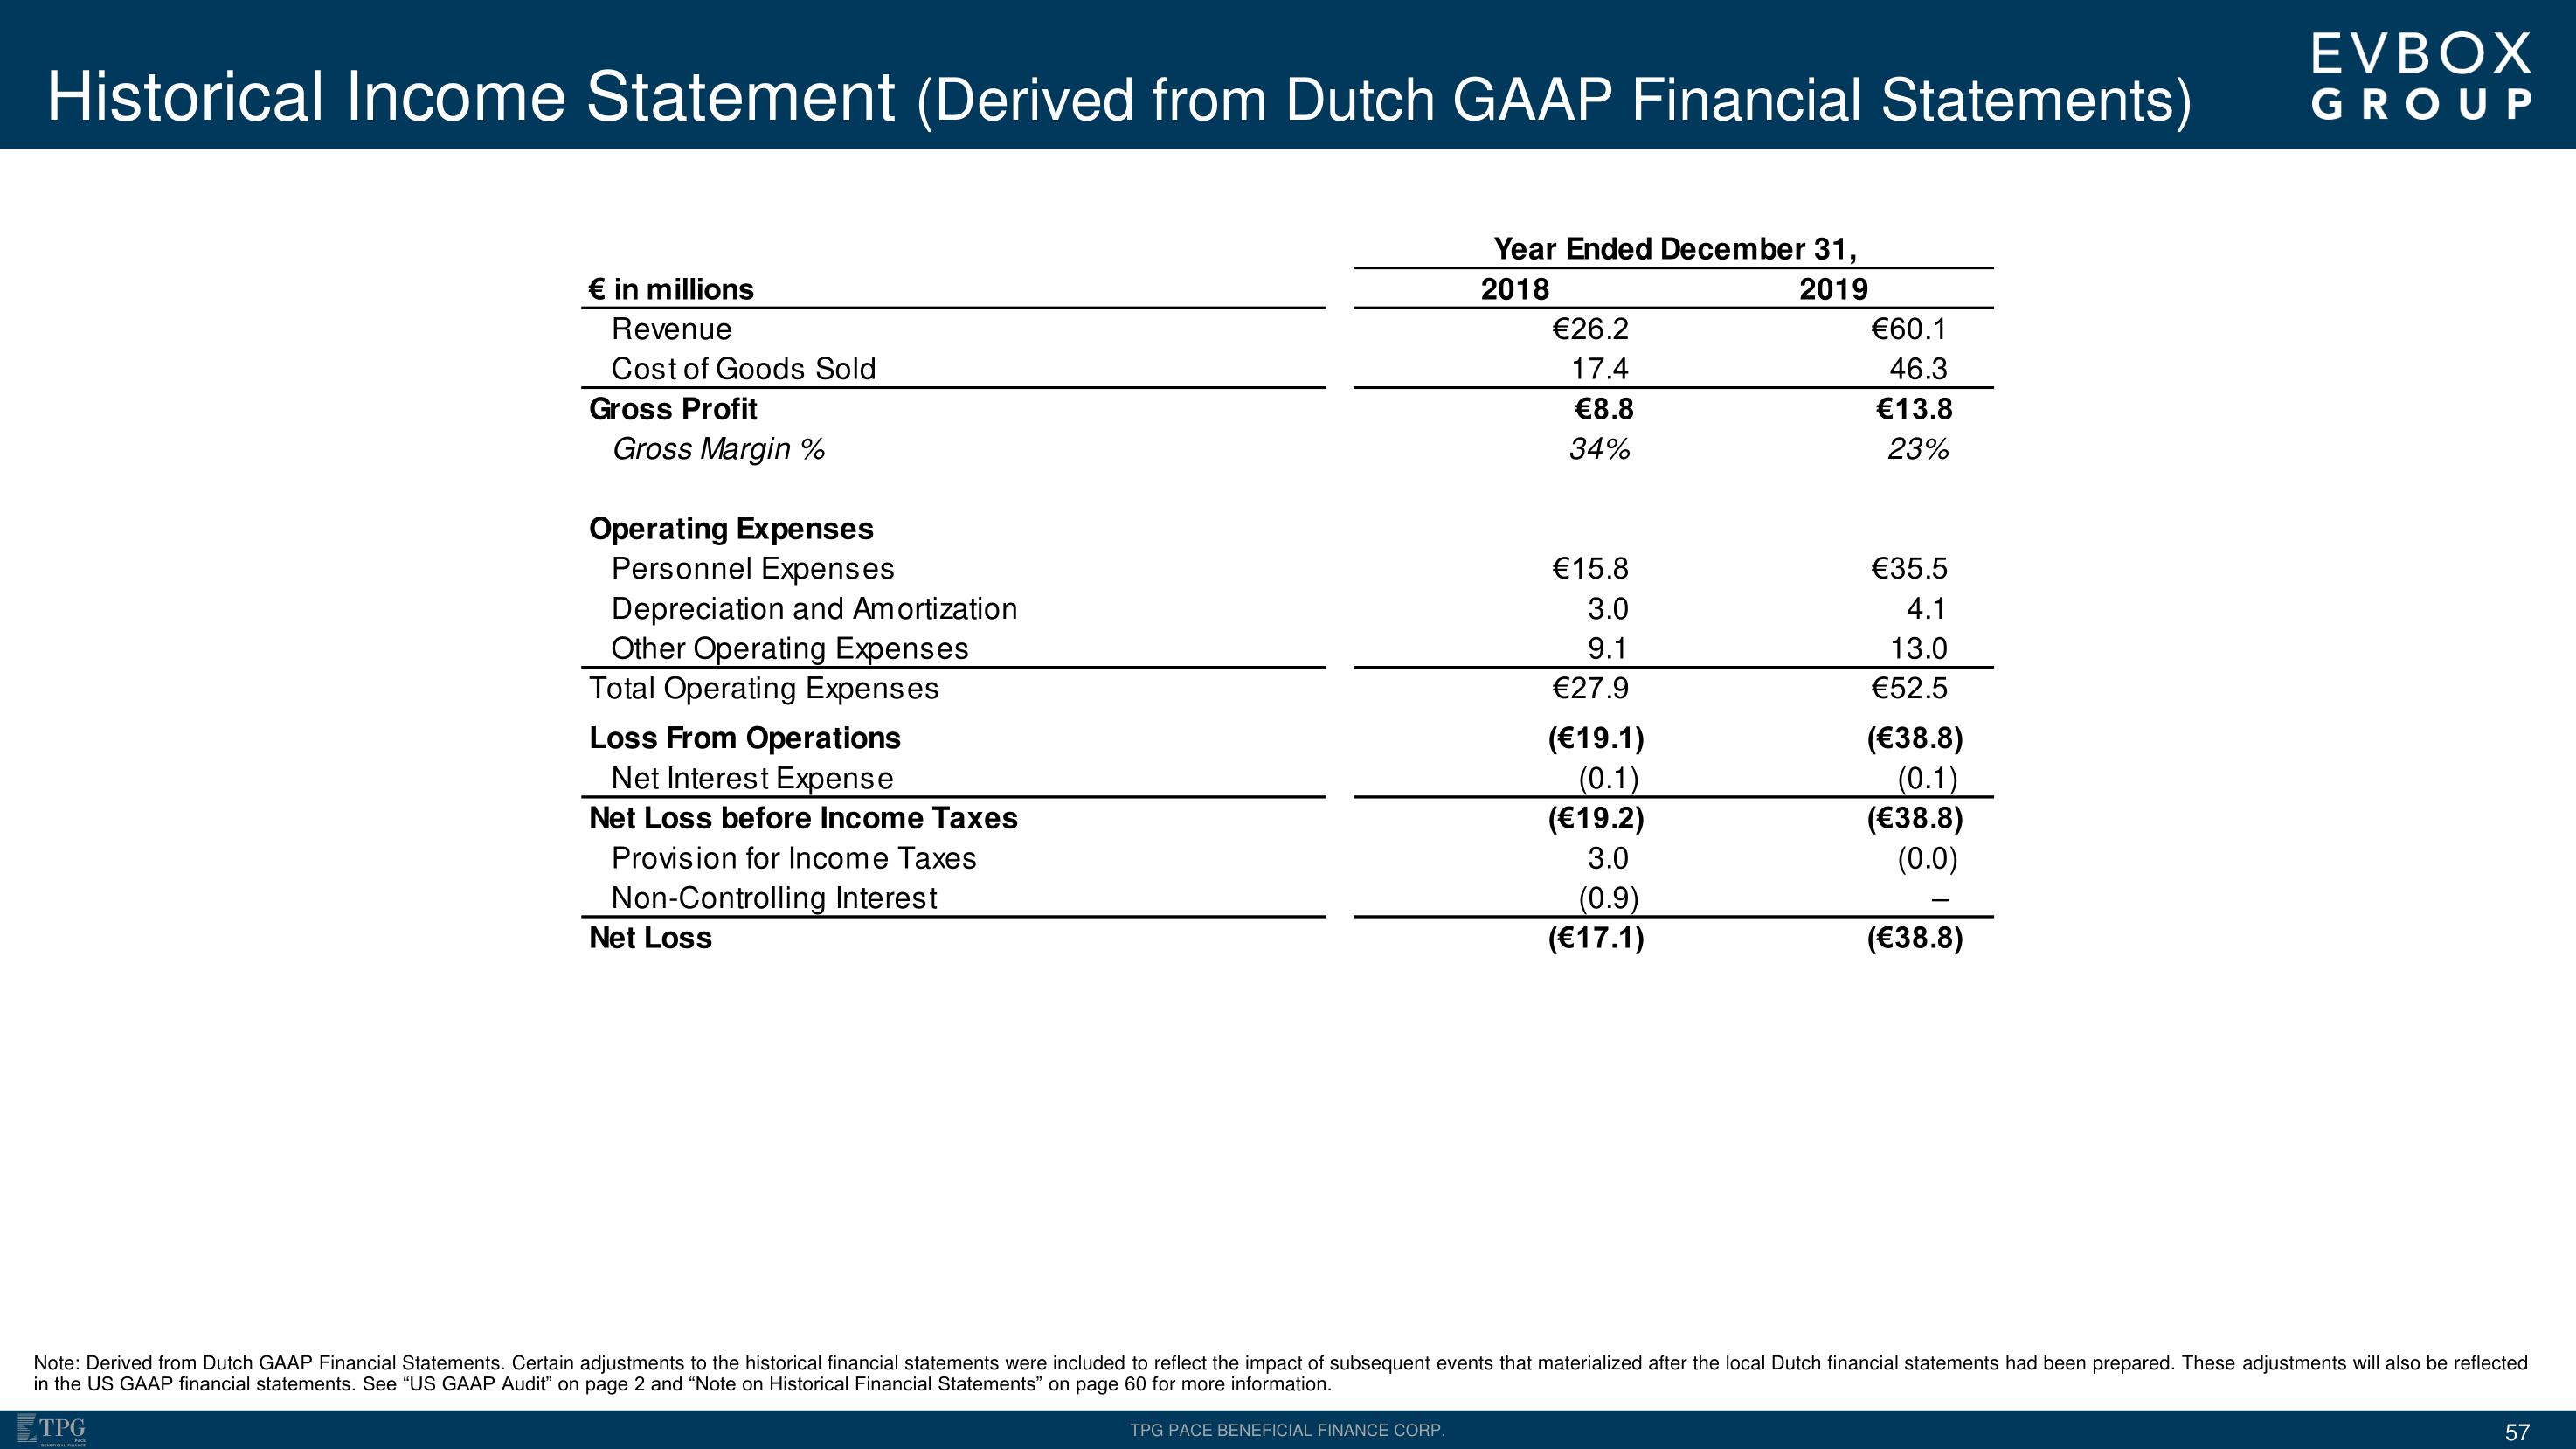
Historical Income Statement (Derived from Dutch GAAP Financial Statements)
Year Ended December 31,
2018
2019
€ in millions
Revenue
Cost of Goods Sold
Gross Profit
Gross Margin %
Operating Expenses
Personnel Expenses
Depreciation and Amortization
Other Operating Expenses
Total Operating Expenses
Loss From Operations
Net Interest Expense
Net Loss before Income Taxes
Provision for Income Taxes
Non-Controlling Interest
Net Loss
€26.2
17.4
€8.8
34%
TPG PACE BENEFICIAL FINANCE CORP.
€15.8
3.0
9.1
€27.9
(€19.1)
(0.1)
(€19.2)
3.0
(0.9)
(€17.1)
€60.1
46.3
€13.8
23%
€35.5
4.1
13.0
€52.5
(€38.8)
(0.1)
(€38.8)
(0.0)
(€38.8)
EVBOX
GROUP
Note: Derived from Dutch GAAP Financial Statements. Certain adjustments to the historical financial statements were included to reflect the impact of subsequent events that materialized after the local Dutch financial statements had been prepared. These adjustments will also be reflected
in the US GAAP financial statements. See "US GAAP Audit" on page 2 and "Note on Historical Financial Statements" on page 60 for more information.
TPG
57View entire presentation