JD Sports Results Presentation Deck
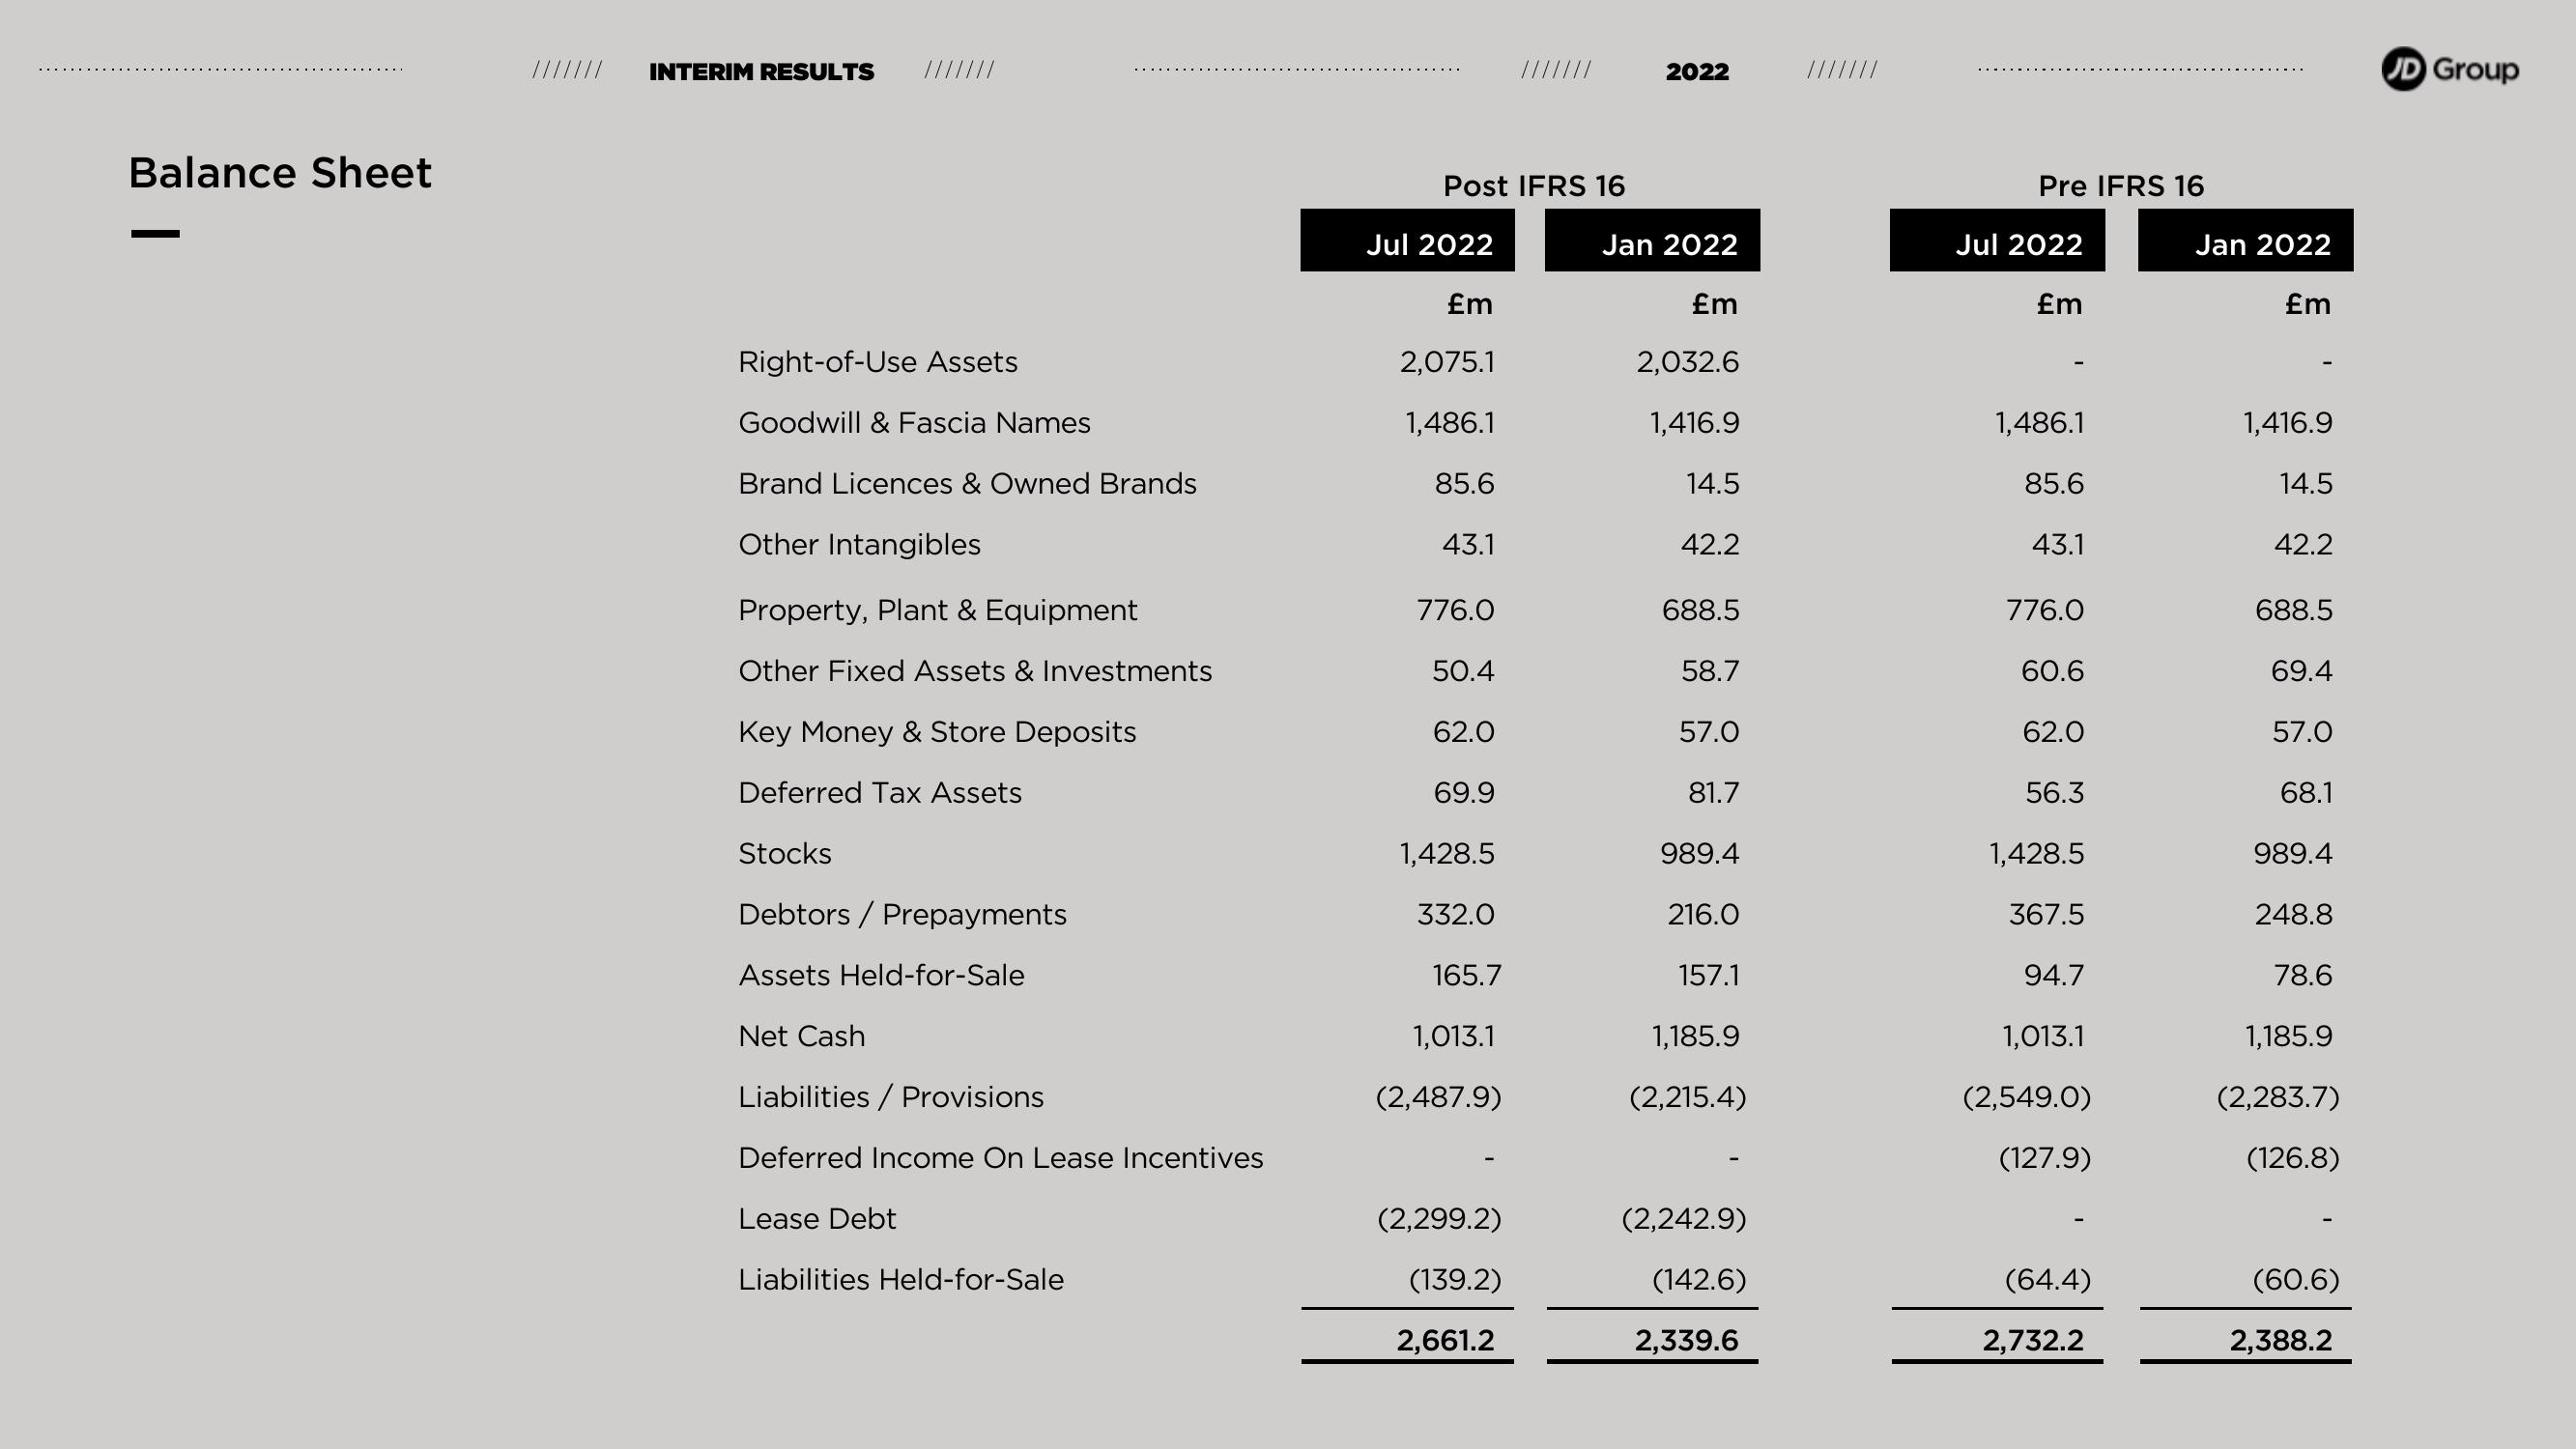
Balance Sheet
INTERIM RESULTS ///////
Right-of-Use Assets
Goodwill & Fascia Names
Brand Licences & Owned Brands
Other Intangibles
Property, Plant & Equipment
Other Fixed Assets & Investments
Key Money & Store Deposits
Deferred Tax Assets
Stocks
Debtors / Prepayments
Assets Held-for-Sale
Net Cash
Liabilities/Provisions
Deferred Income On Lease Incentives
Lease Debt
Liabilities Held-for-Sale
Post IFRS 16
Jul 2022
£m
2,075.1
1,486.1
85.6
43.1
776.0
50.4
62.0
69.9
1,428.5
332.0
165.7
1,013.1
(2,487.9)
///////
(2,299.2)
(139.2)
2,661.2
2022
Jan 2022
£m
2,032.6
1,416.9
14.5
42.2
688.5
58.7
57.0
81.7
989.4
216.0
157.1
1,185.9
(2,215.4)
(2,242.9)
(142.6)
2,339.6
Pre IFRS 16
Jul 2022
£m
1,486.1
85.6
43.1
776.0
60.6
62.0
56.3
1,428.5
367.5
94.7
1,013.1
(2,549.0)
(127.9)
(64.4)
2,732.2
Jan 2022
£m
1,416.9
14.5
42.2
688.5
69.4
57.0
68.1
989.4
248.8
78.6
1,185.9
(2,283.7)
(126.8)
(60.6)
2,388.2
JD GroupView entire presentation