Melrose Results Presentation Deck
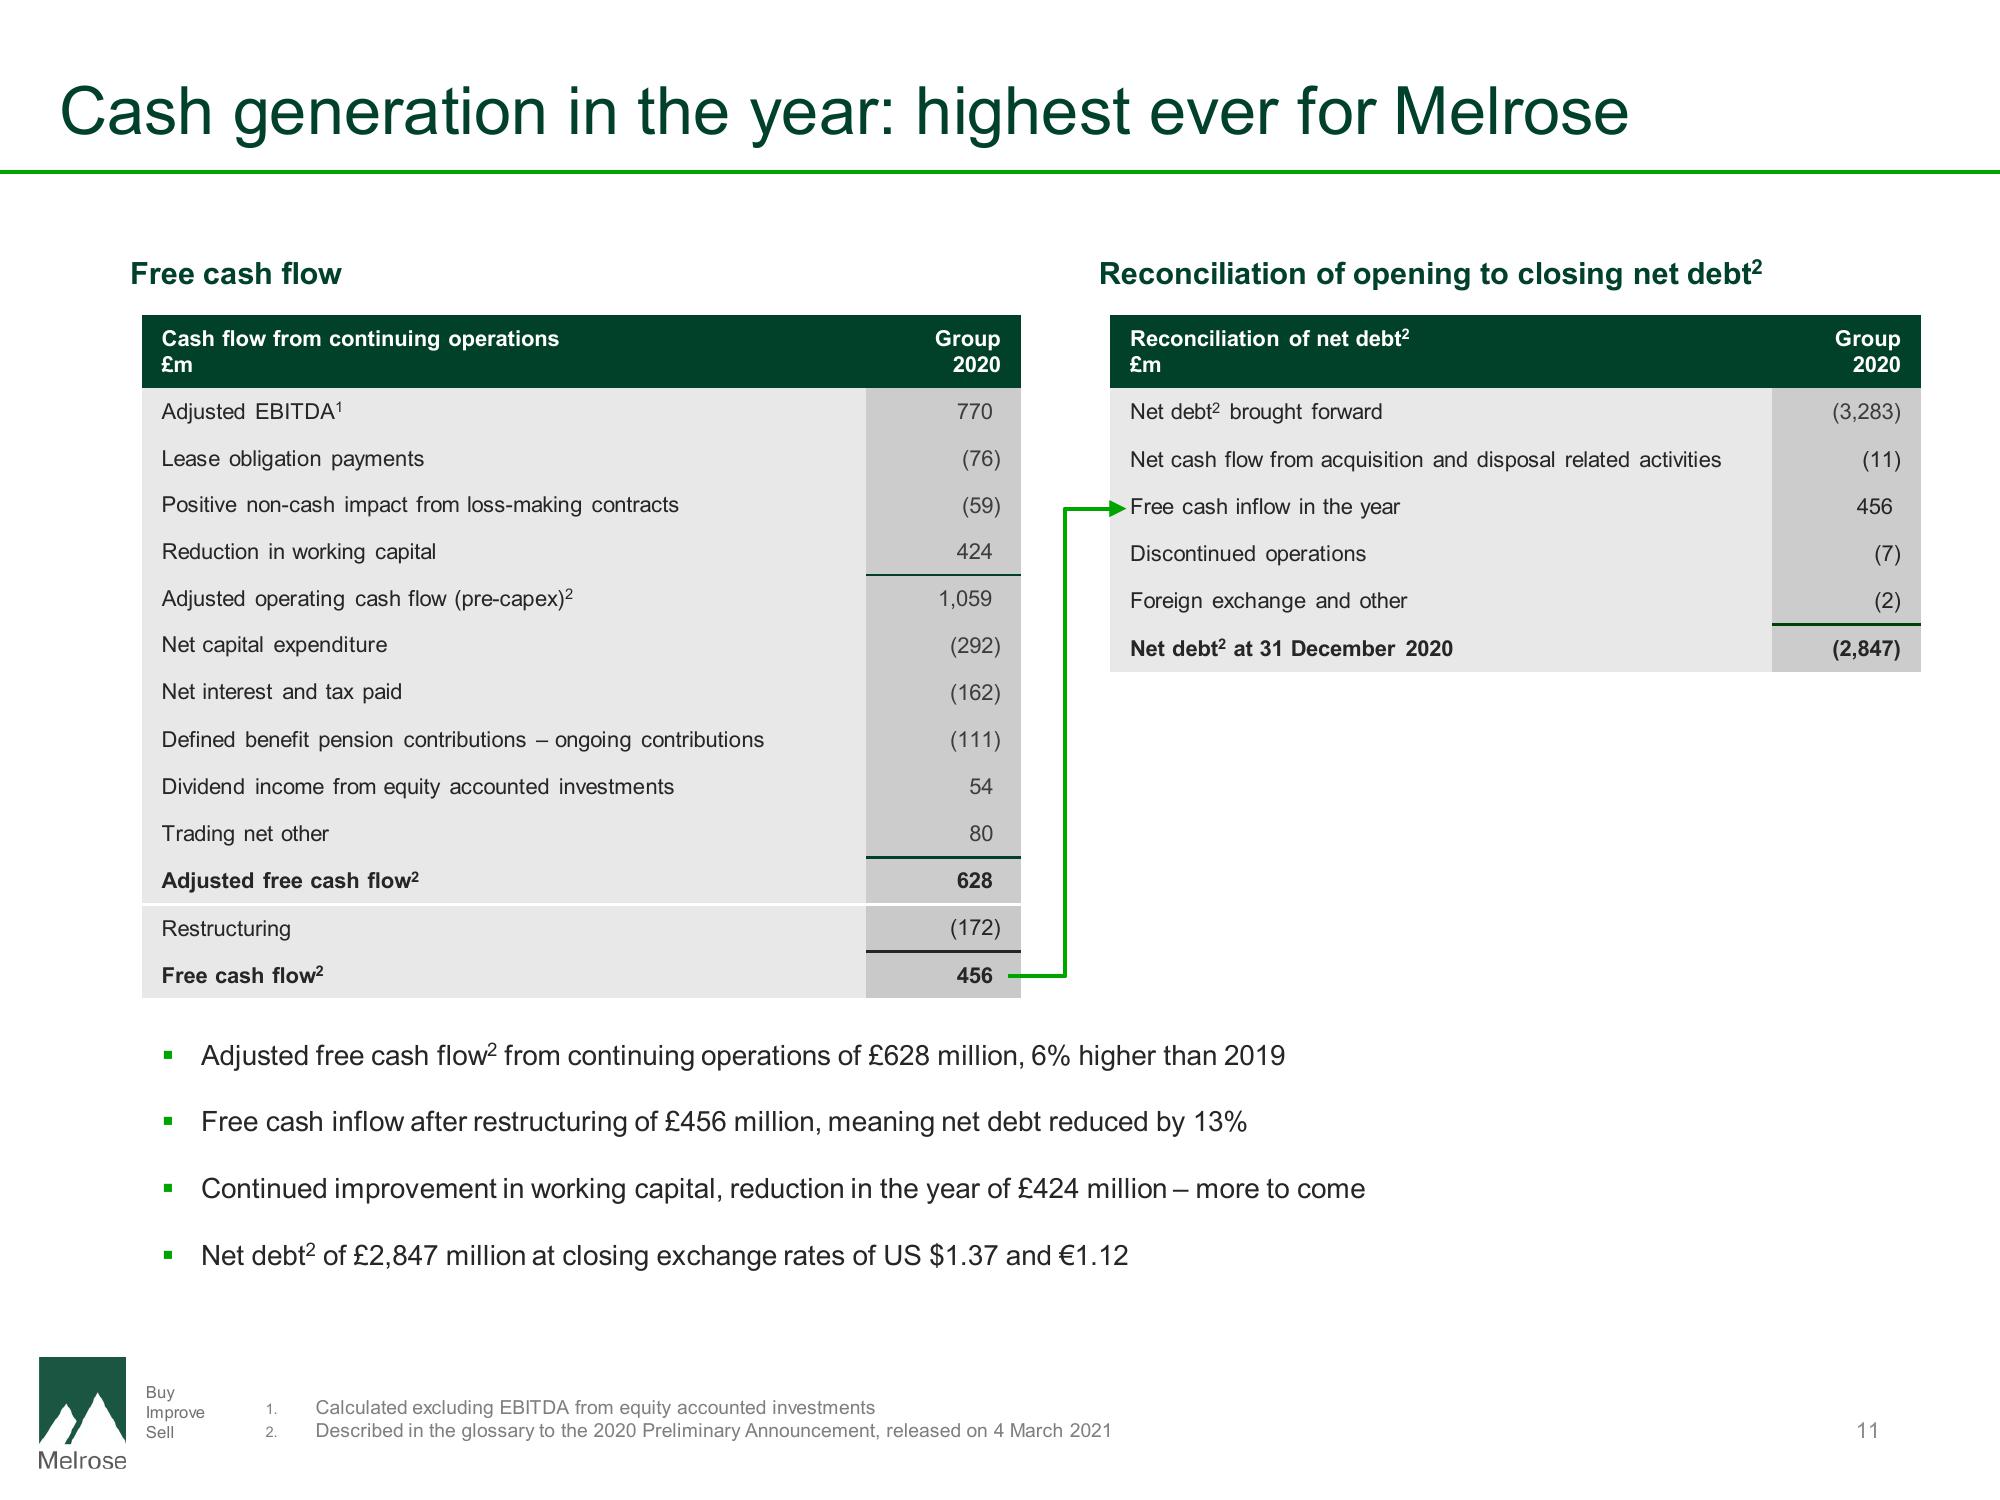
Cash generation in the year: highest ever for Melrose
Melrose
Free cash flow
Cash flow from continuing operations
£m
Adjusted EBITDA¹
Lease obligation payments
Positive non-cash impact from loss-making contracts
Reduction in working capital
Adjusted operating cash flow (pre-capex)²
Net capital expenditure
Net interest and tax paid
Defined benefit pension contributions - ongoing contributions
Dividend income from equity accounted investments
Trading net other
Adjusted free cash flow²
Restructuring
Free cash flow²
■
I
■
I
Group
2020
Buy
Improve
Sell
770
(76)
(59)
424
1,059
(292)
(162)
(111)
54
80
628
(172)
456
Reconciliation of opening to closing net debt²
Reconciliation of net debt²
Adjusted free cash flow² from continuing operations of £628 million, 6% higher than 2019
Free cash inflow after restructuring of £456 million, meaning net debt reduced by 13%
Continued improvement in working capital, reduction in the year of £424 million - more to come
Net debt² of £2,847 million at closing exchange rates of US $1.37 and €1.12
£m
Net debt2 brought forward
Net cash flow from acquisition and disposal related activities
Free cash inflow in the year
Discontinued operations
Foreign exchange and other
Net debt² at 31 December 2020
1. Calculated excluding EBITDA from equity accounted investments
2. Described in the glossary to the 2020 Preliminary Announcement, released on 4 March 2021
Group
2020
(3,283)
(11)
456
(7)
(2)
(2,847)
11View entire presentation