TPG Results Presentation Deck
Realized Performance Allocations, Net
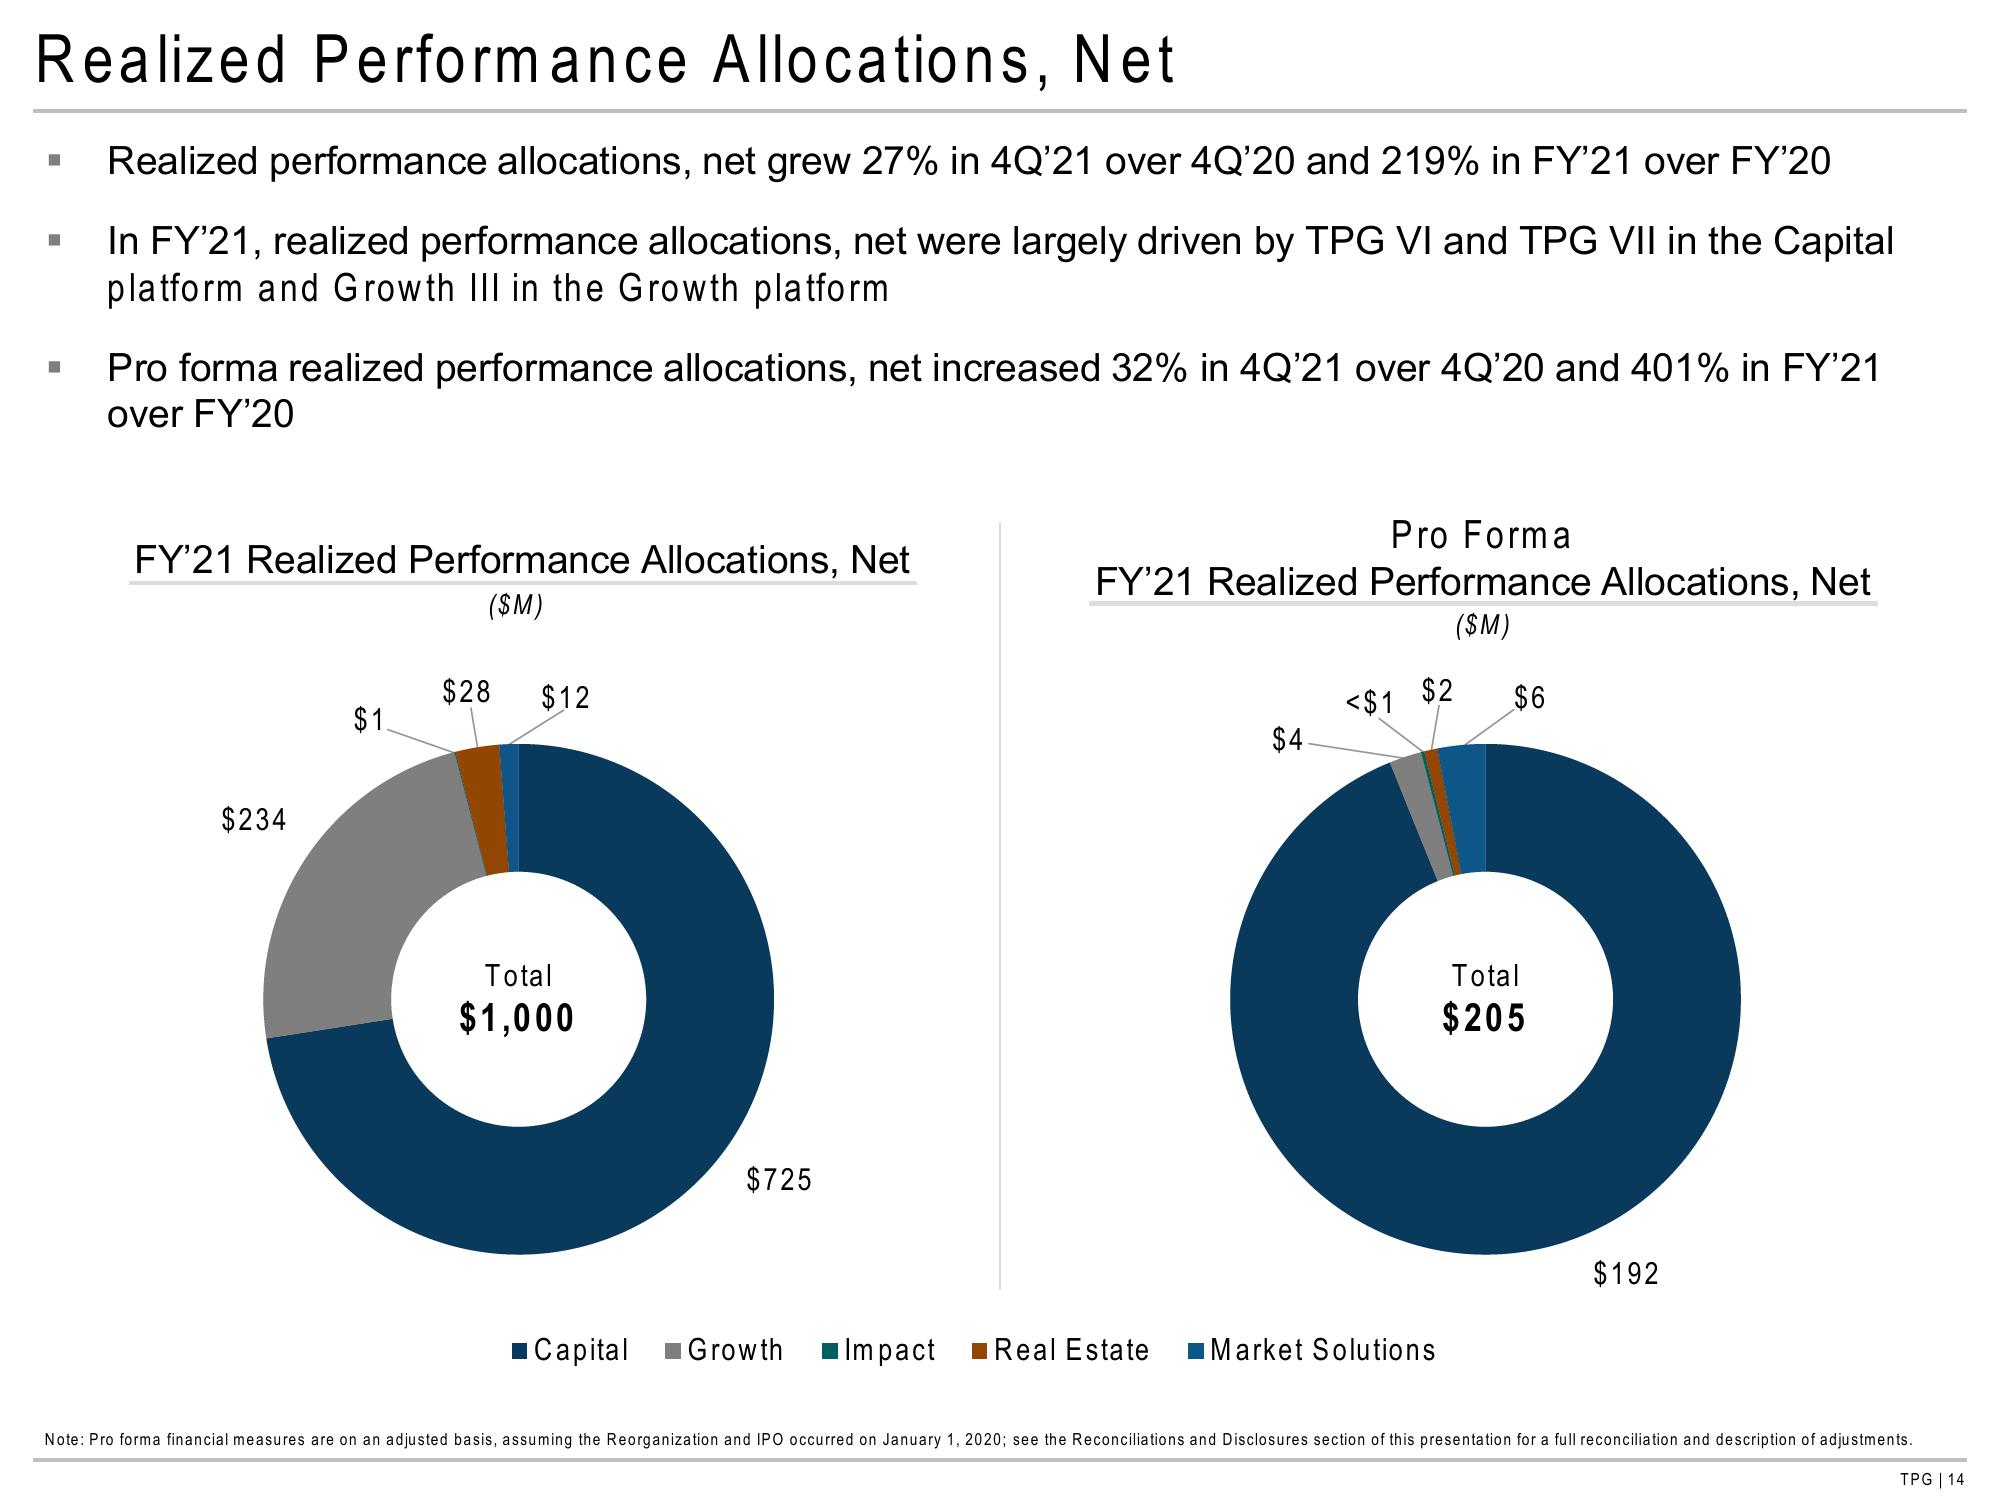
Realized performance allocations, net grew 27% in 4Q'21 over 4Q'20 and 219% in FY'21 over FY'20
In FY'21, realized performance allocations, net were largely driven by TPG VI and TPG VII in the Capital
platform and Growth III in the Growth platform
■
■
■
Pro forma realized performance allocations, net increased 32% in 4Q'21 over 4Q'20 and 401% in FY'21
over FY'20
FY'21 Realized Performance Allocations, Net
($M)
$234
$1.
$28 $12
Total
$1,000
■Capital
$725
Pro Forma
FY'21 Realized Performance Allocations, Net
($M)
$4
$2
<$1
Growth ■Impact ■ Real Estate Market Solutions
$6
Total
$205
$192
Note: Pro forma financial measures are on an adjusted basis, assuming the Reorganization and IPO occurred on January 1, 2020; see the Reconciliations and Disclosures section of this presentation for a full reconciliation and description of adjustments.
TPG | 14View entire presentation