Inovalon Results Presentation Deck
Updated 2017 Financial Guidance Summary inovalon™
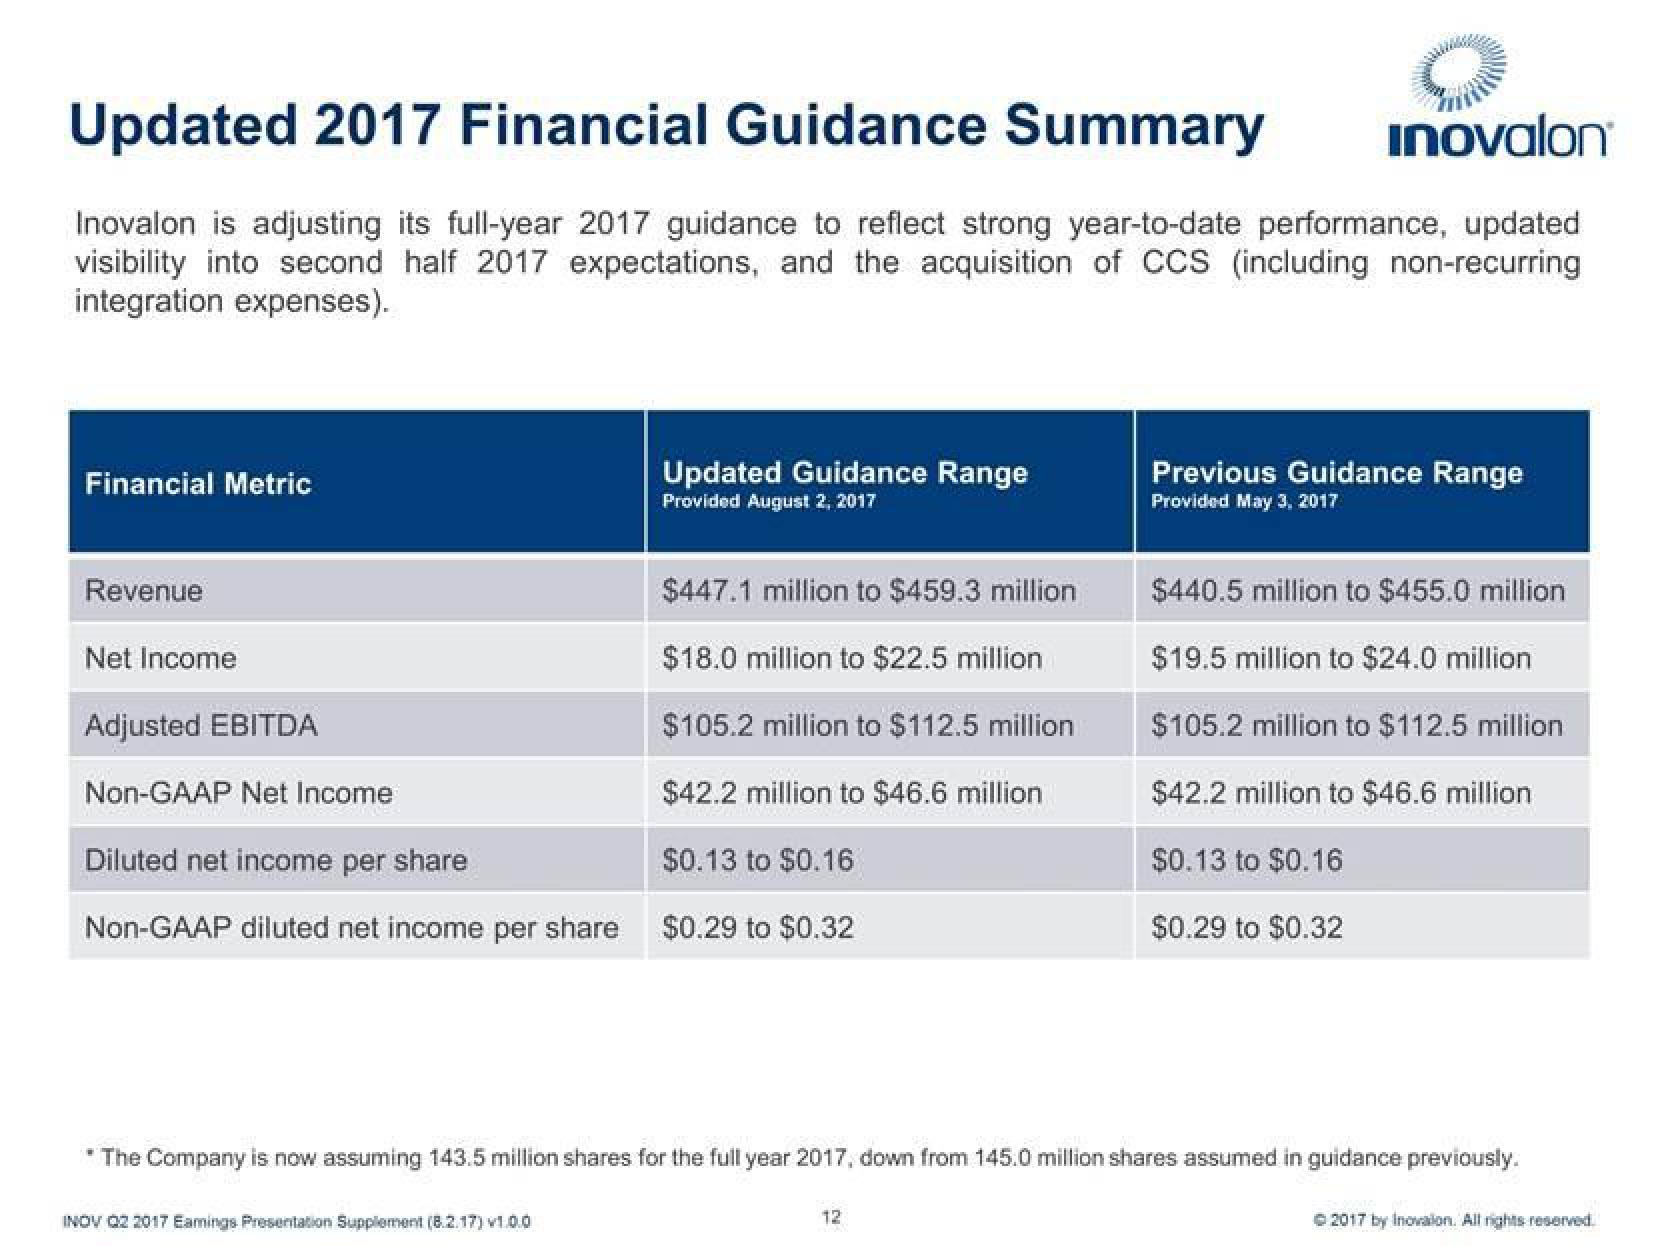
Inovalon is adjusting its full-year 2017 guidance to reflect strong year-to-date performance, updated
visibility into second half 2017 expectations, and the acquisition of CCS (including non-recurring
integration expenses).
Financial Metric
Revenue
Net Income
Adjusted EBITDA
Non-GAAP Net Income
Diluted net income per share
Non-GAAP diluted net income per share
Updated Guidance Range
Provided August 2, 2017
INOV 02 2017 Eamings Presentation Supplement (8.2.17) v1.0.0
$447.1 million to $459.3 million
$18.0 million to $22.5 million
$105.2 million to $112.5 million
$42.2 million to $46.6 million
FONTE
$0.13 to $0.16
$0.29 to $0.32
Previous Guidance Range
Provided May 3, 2017
*The Company is now assuming 143.5 million shares for the full year 2017, down from 145.0 million shares assumed in guidance previously.
12
$440.5 million to $455.0 million
$19.5 million to $24.0 million
$105.2 million to $112.5 million
$42.2 million to $46.6 million
$0.13 to $0.16
$0.29 to $0.32
© 2017 by Inovalon. All rights reserved.View entire presentation