GlobalFoundries Results Presentation Deck
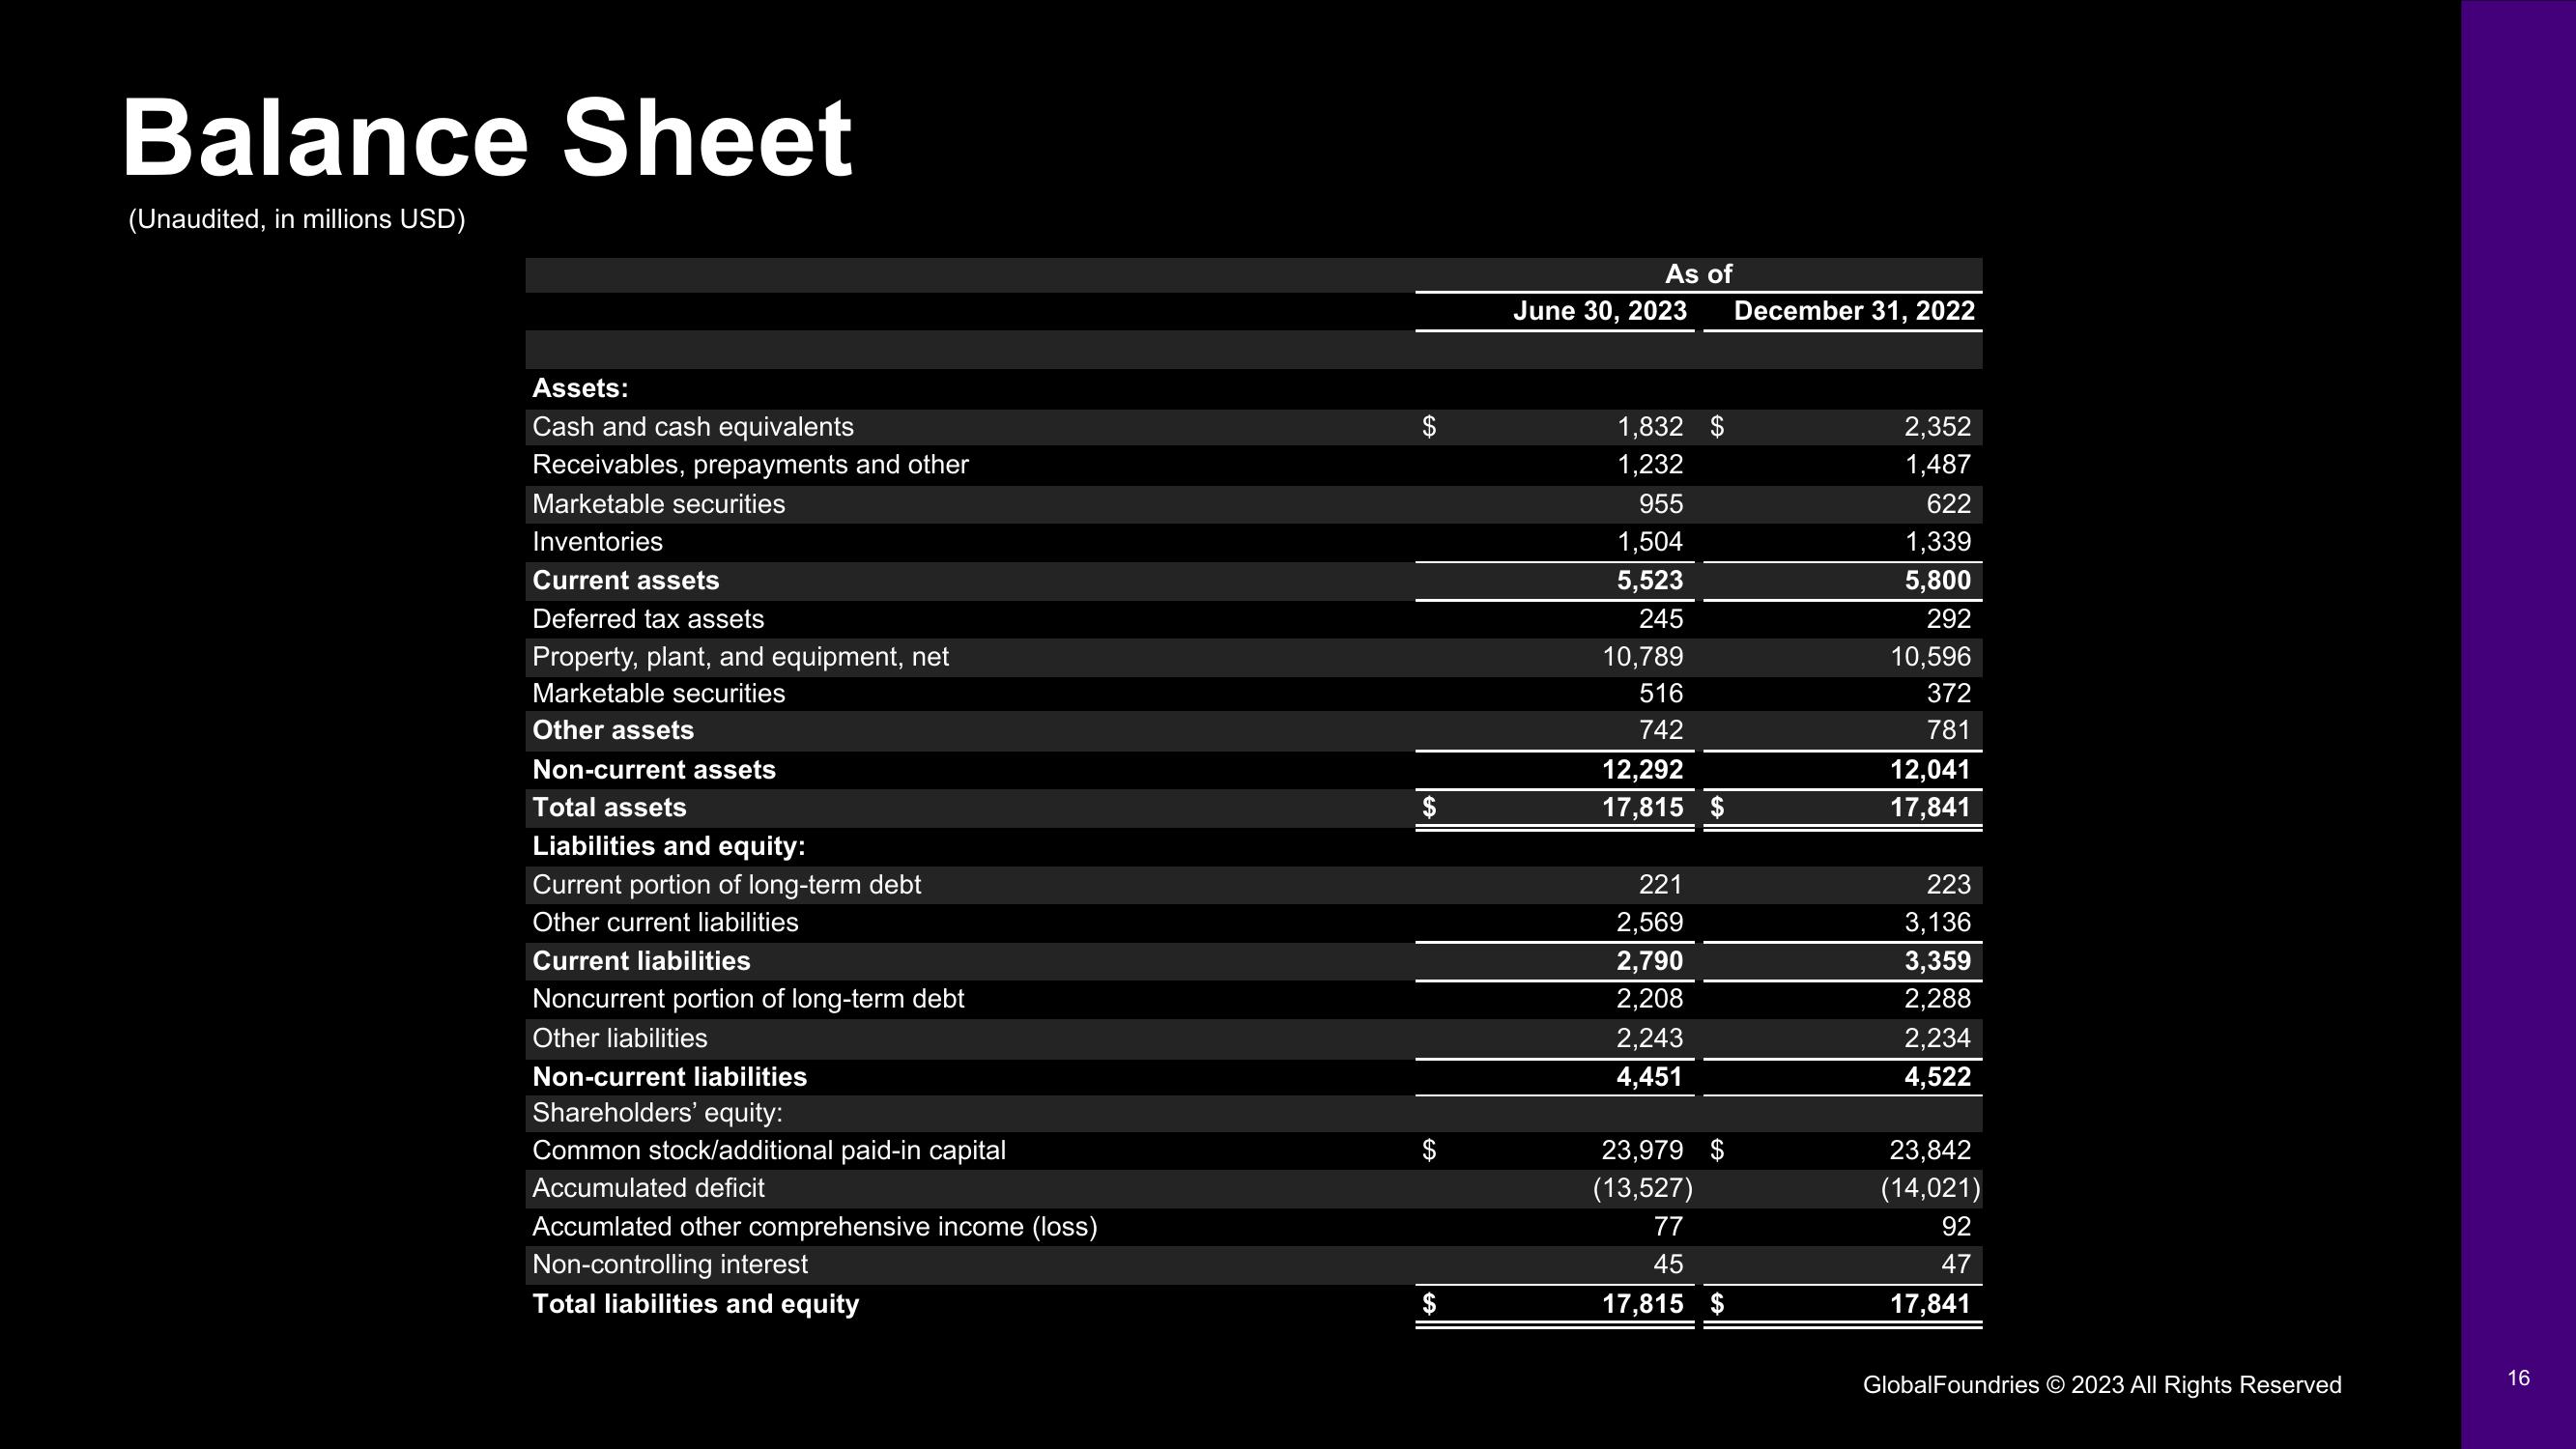
Balance Sheet
(Unaudited, in millions USD)
Assets:
Cash and cash equivalents
Receivables, prepayments and other
Marketable securities
Inventories
Current assets
Deferred tax assets
Property, plant, and equipment, net
Marketable securities
Other assets
Non-current assets
Total assets
Liabilities and equity:
Current portion of long-term debt
Other current liabilities
Current liabilities
Noncurrent portion of long-term debt
Other liabilities
Non-current liabilities
Shareholders' equity:
Common stock/additional paid-in capital
Accumulated deficit
Accumlated other comprehensive income (loss)
Non-controlling interest
Total liabilities and equity
As of
June 30, 2023 December 31, 2022
1,832 $
1,232
955
1,504
5,523
245
10,789
516
742
12,292
17,815 $
221
2,569
2,790
2,208
2,243
4,451
23,979 $
(13,527)
77
45
17,815 $
2,352
1,487
622
1,339
5,800
292
10,596
372
781
12,041
17,841
223
3,136
3,359
2,288
2,234
4,522
23,842
(14,021)
92
47
17,841
GlobalFoundries © 2023 All Rights Reserved
16View entire presentation