Twitter Results Presentation Deck
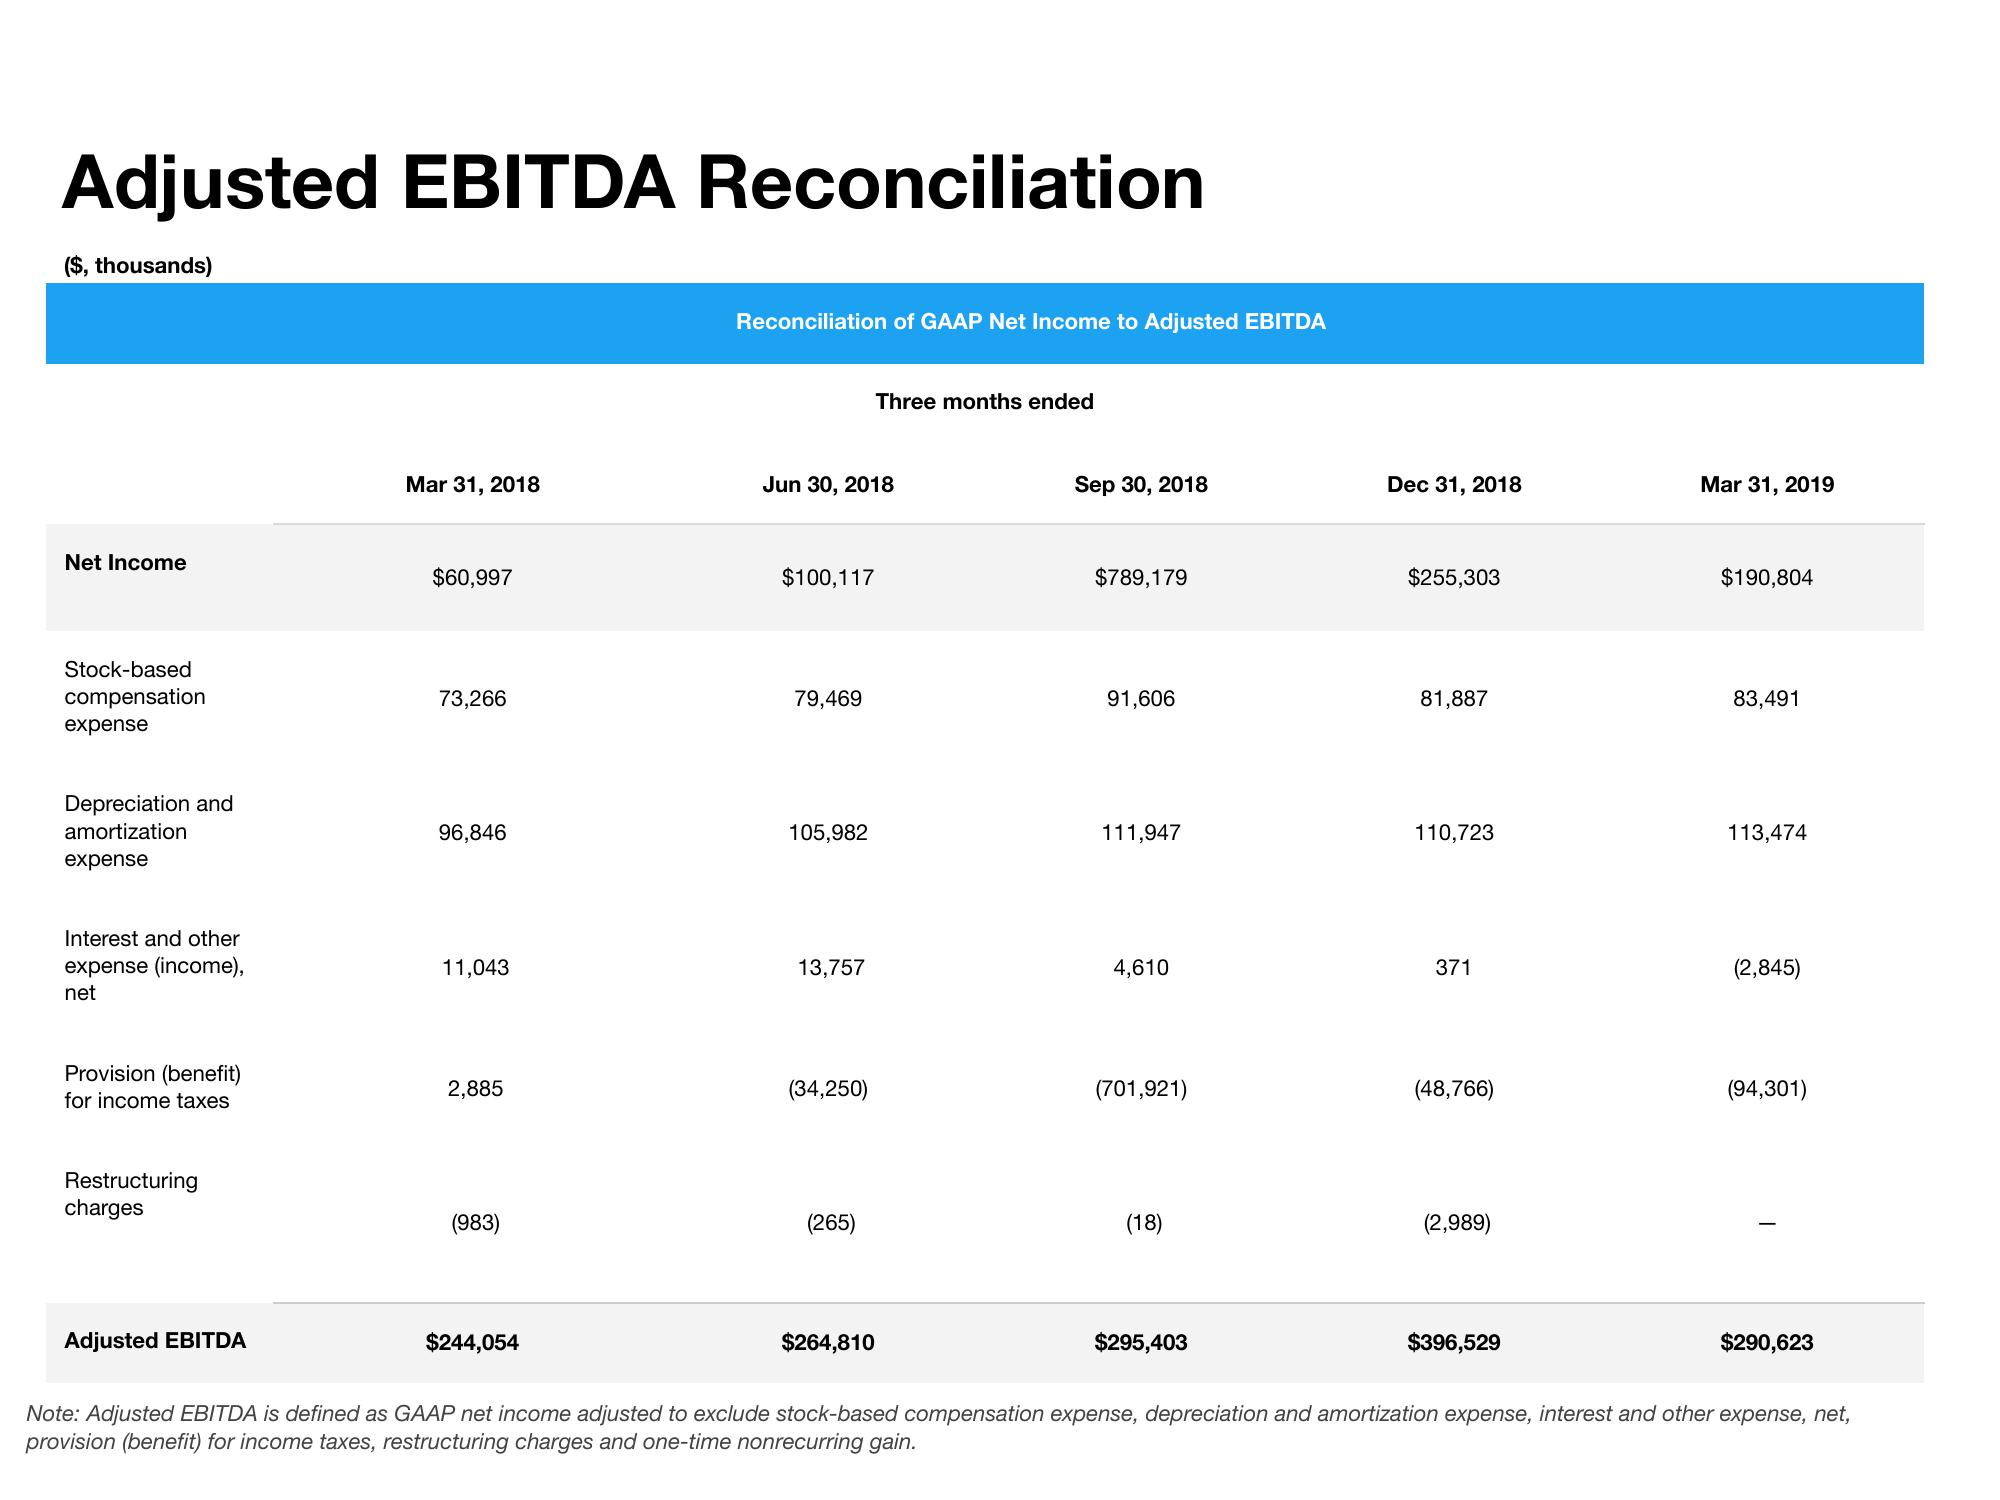
Adjusted EBITDA Reconciliation
($, thousands)
Net Income
Stock-based
compensation
expense
Depreciation and
amortization
expense
Interest and other
expense (income),
net
Provision (benefit)
for income taxes
Restructuring
charges
Adjusted EBITDA
Mar 31, 2018
$60,997
73,266
96,846
11,043
2,885
(983)
$244,054
Reconciliation of GAAP Net Income to Adjusted EBITDA
Jun 30, 2018
$100,117
79,469
105,982
13,757
(34,250)
(265)
Three months ended
$264,810
Sep 30, 2018
$789,179
91,606
111,947
4,610
(701,921)
(18)
$295,403
Dec 31, 2018
$255,303
81,887
110,723
371
(48,766)
(2,989)
$396,529
Mar 31, 2019
$190,804
83,491
113,474
(2,845)
(94,301)
$290,623
Note: Adjusted EBITDA is defined as GAAP net income adjusted to exclude stock-based compensation expense, depreciation and amortization expense, interest and other expense, net,
provision (benefit) for income taxes, restructuring charges and one-time nonrecurring gain.View entire presentation