Truist Financial Corp Results Presentation Deck
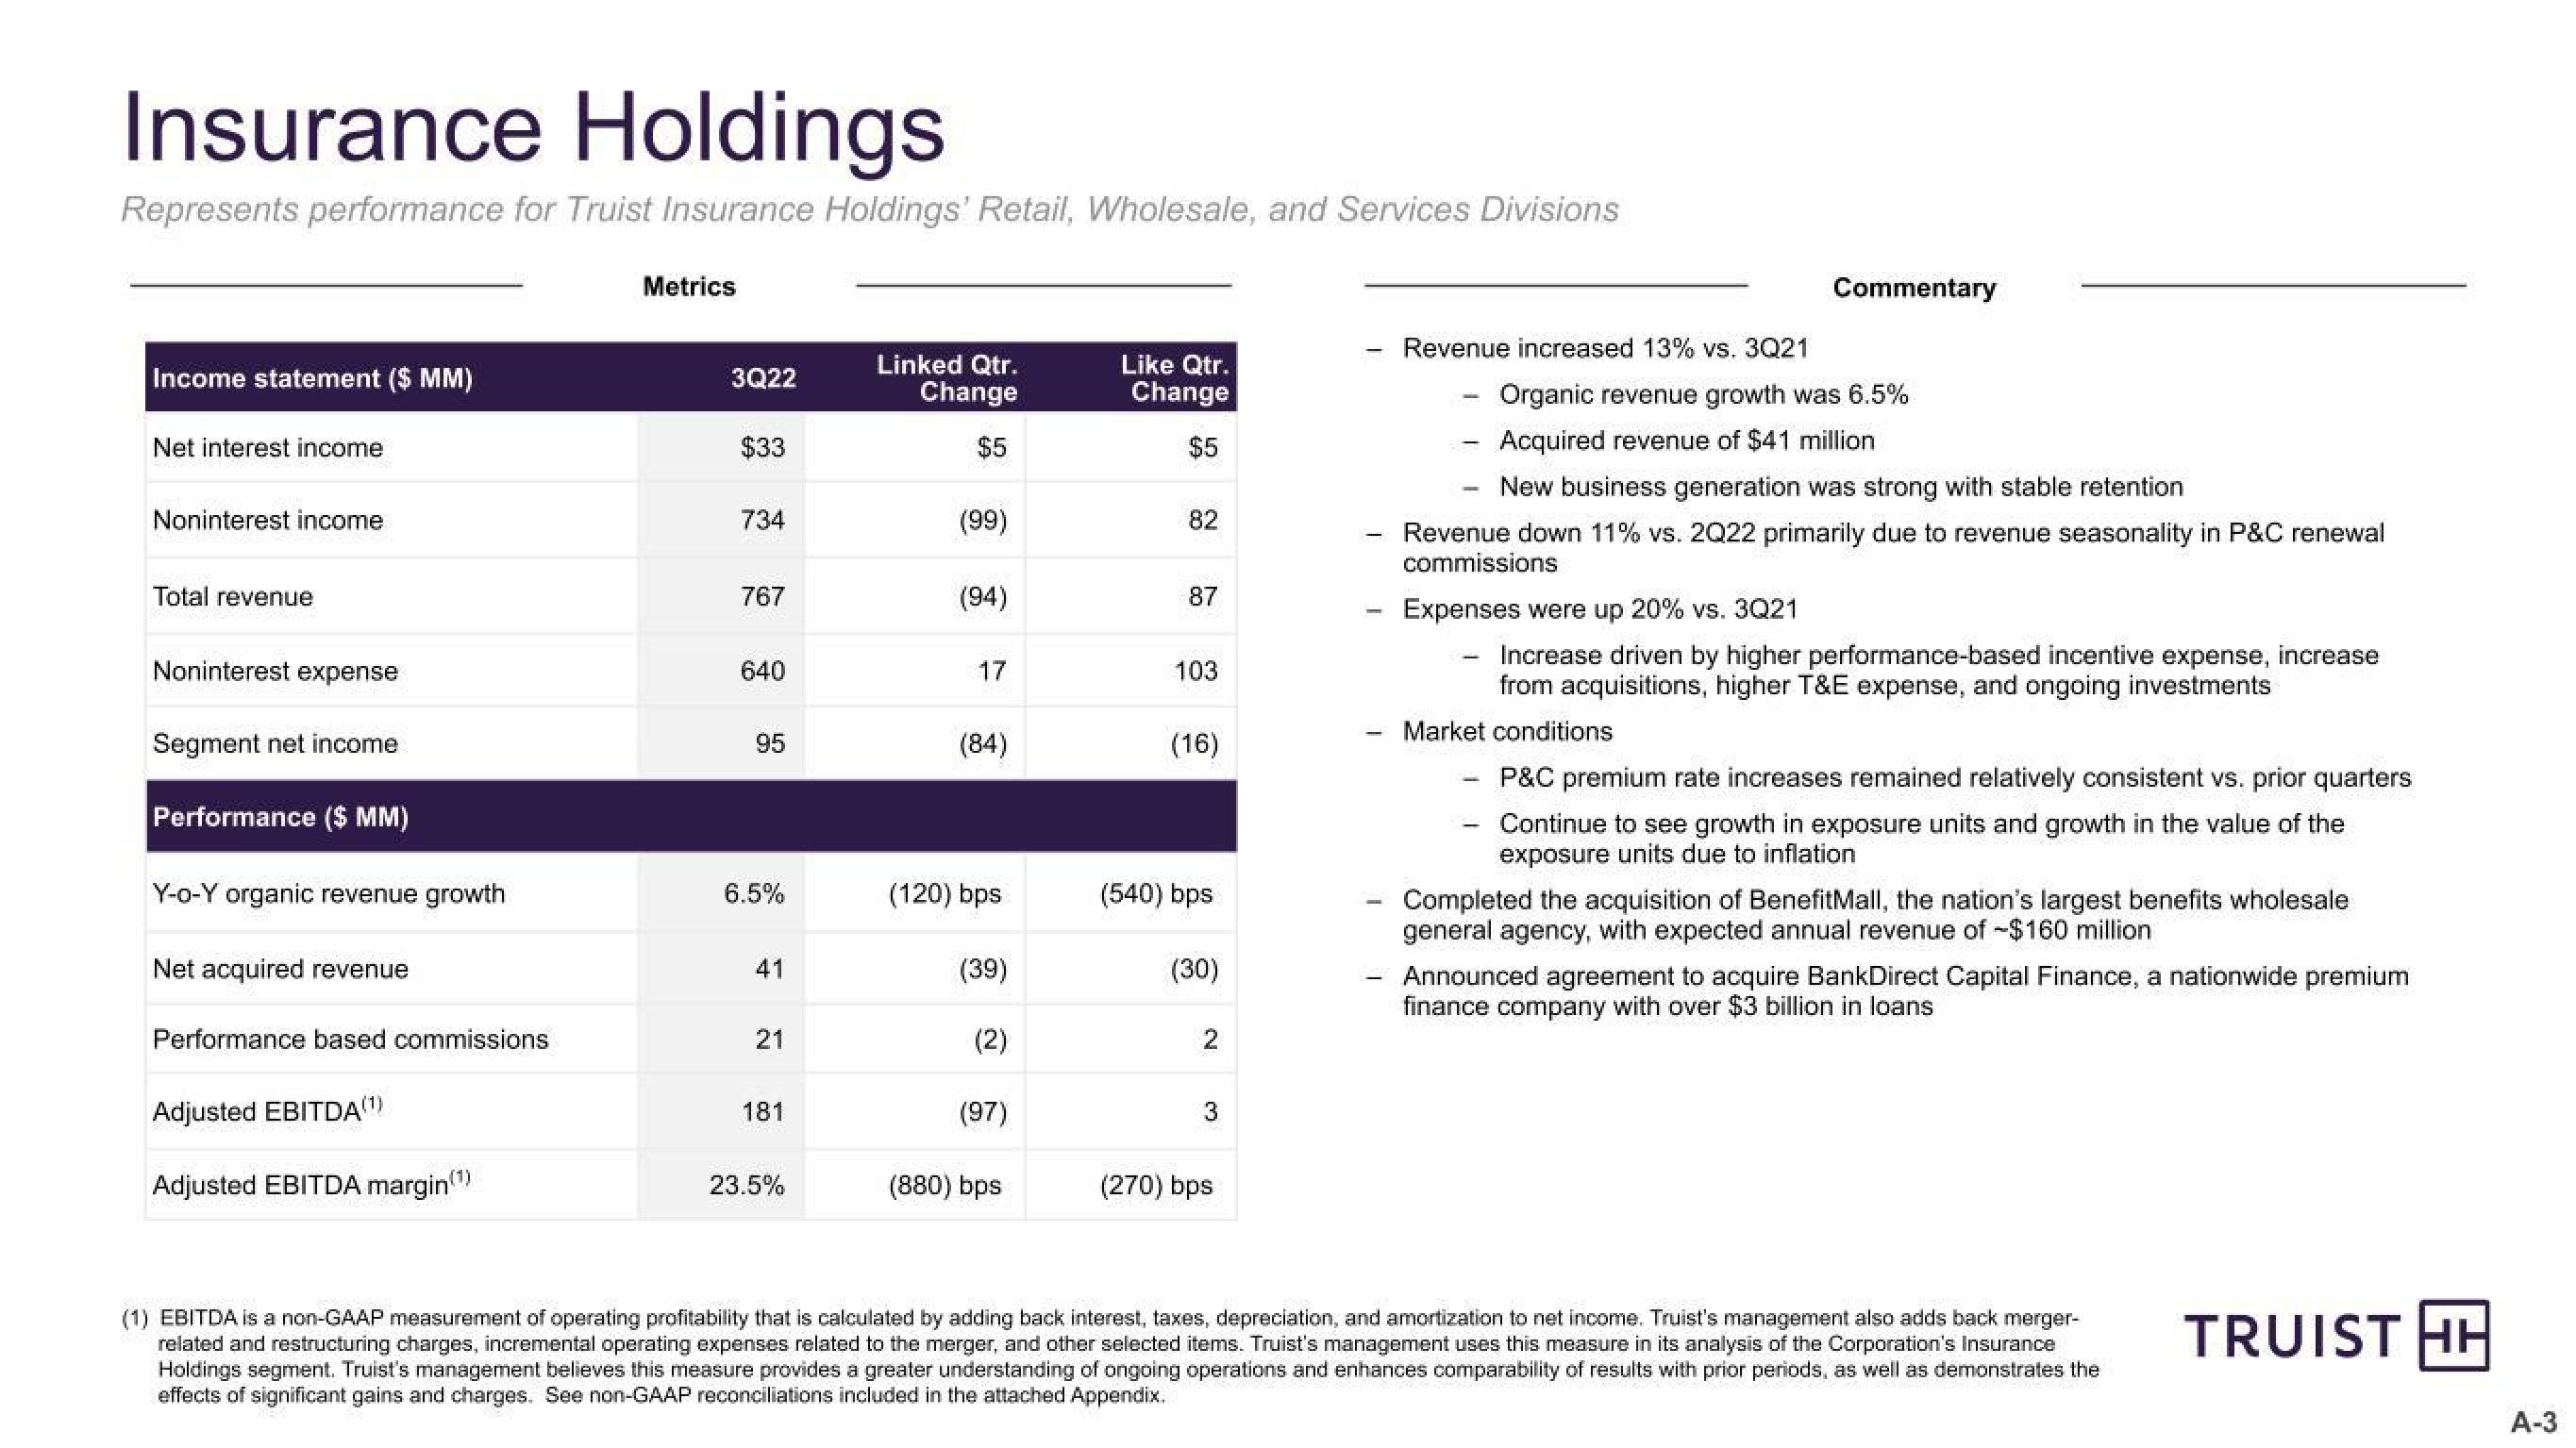
Insurance Holdings
Represents performance for Truist Insurance Holdings' Retail, Wholesale, and Services Divisions
Income statement ($ MM)
Net interest income
Noninterest income
Total revenue
Noninterest expense
Segment net income
Performance ($ MM)
Y-o-Y organic revenue growth
Net acquired revenue
Performance based commissions
Adjusted EBITDA(¹)
Adjusted EBITDA margin(¹)
Metrics
3Q22
$33
734
767
640
95
6.5%
41
21
181
23.5%
Linked Qtr.
Change
$5
(99)
(94)
17
(84)
(120) bps
(39)
(2)
(97)
(880) bps
Like Qtr.
Change
$5
82
87
103
(16)
(540) bps
(30)
2
3
(270) bps
-
-
-
Revenue increased 13% vs. 3Q21
Organic revenue growth was 6.5%
Acquired revenue of $41 million
New business generation was strong with stable retention
Revenue down 11% vs. 2Q22 primarily due to revenue seasonality in P&C renewal
commissions
Expenses were up 20% vs. 3Q21
Commentary
-
Market conditions
Increase driven by higher performance-based incentive expense, increase
from acquisitions, higher T&E expense, and ongoing investments
P&C premium rate increases remained relatively consistent vs. prior quarters
Continue to see growth in exposure units and growth in the value of the
exposure units due to inflation
Completed the acquisition of BenefitMall, the nation's largest benefits wholesale
general agency, with expected annual revenue of $160 million
Announced agreement to acquire BankDirect Capital Finance, a nationwide premium
finance company with over $3 billion in loans
(1) EBITDA is a non-GAAP measurement of operating profitability that is calculated by adding back interest, taxes, depreciation, and amortization to net income. Truist's management also adds back merger-
related and restructuring charges, incremental operating expenses related to the merger, and other selected items. Truist's management uses this measure in its analysis of the Corporation's Insurance
Holdings segment. Truist's management believes this measure provides a greater understanding of ongoing operations and enhances comparability of results with prior periods, as well as demonstrates the
effects of significant gains and charges. See non-GAAP reconciliations included in the attached Appendix.
TRUIST HH
A-3View entire presentation