Spotify Results Presentation Deck
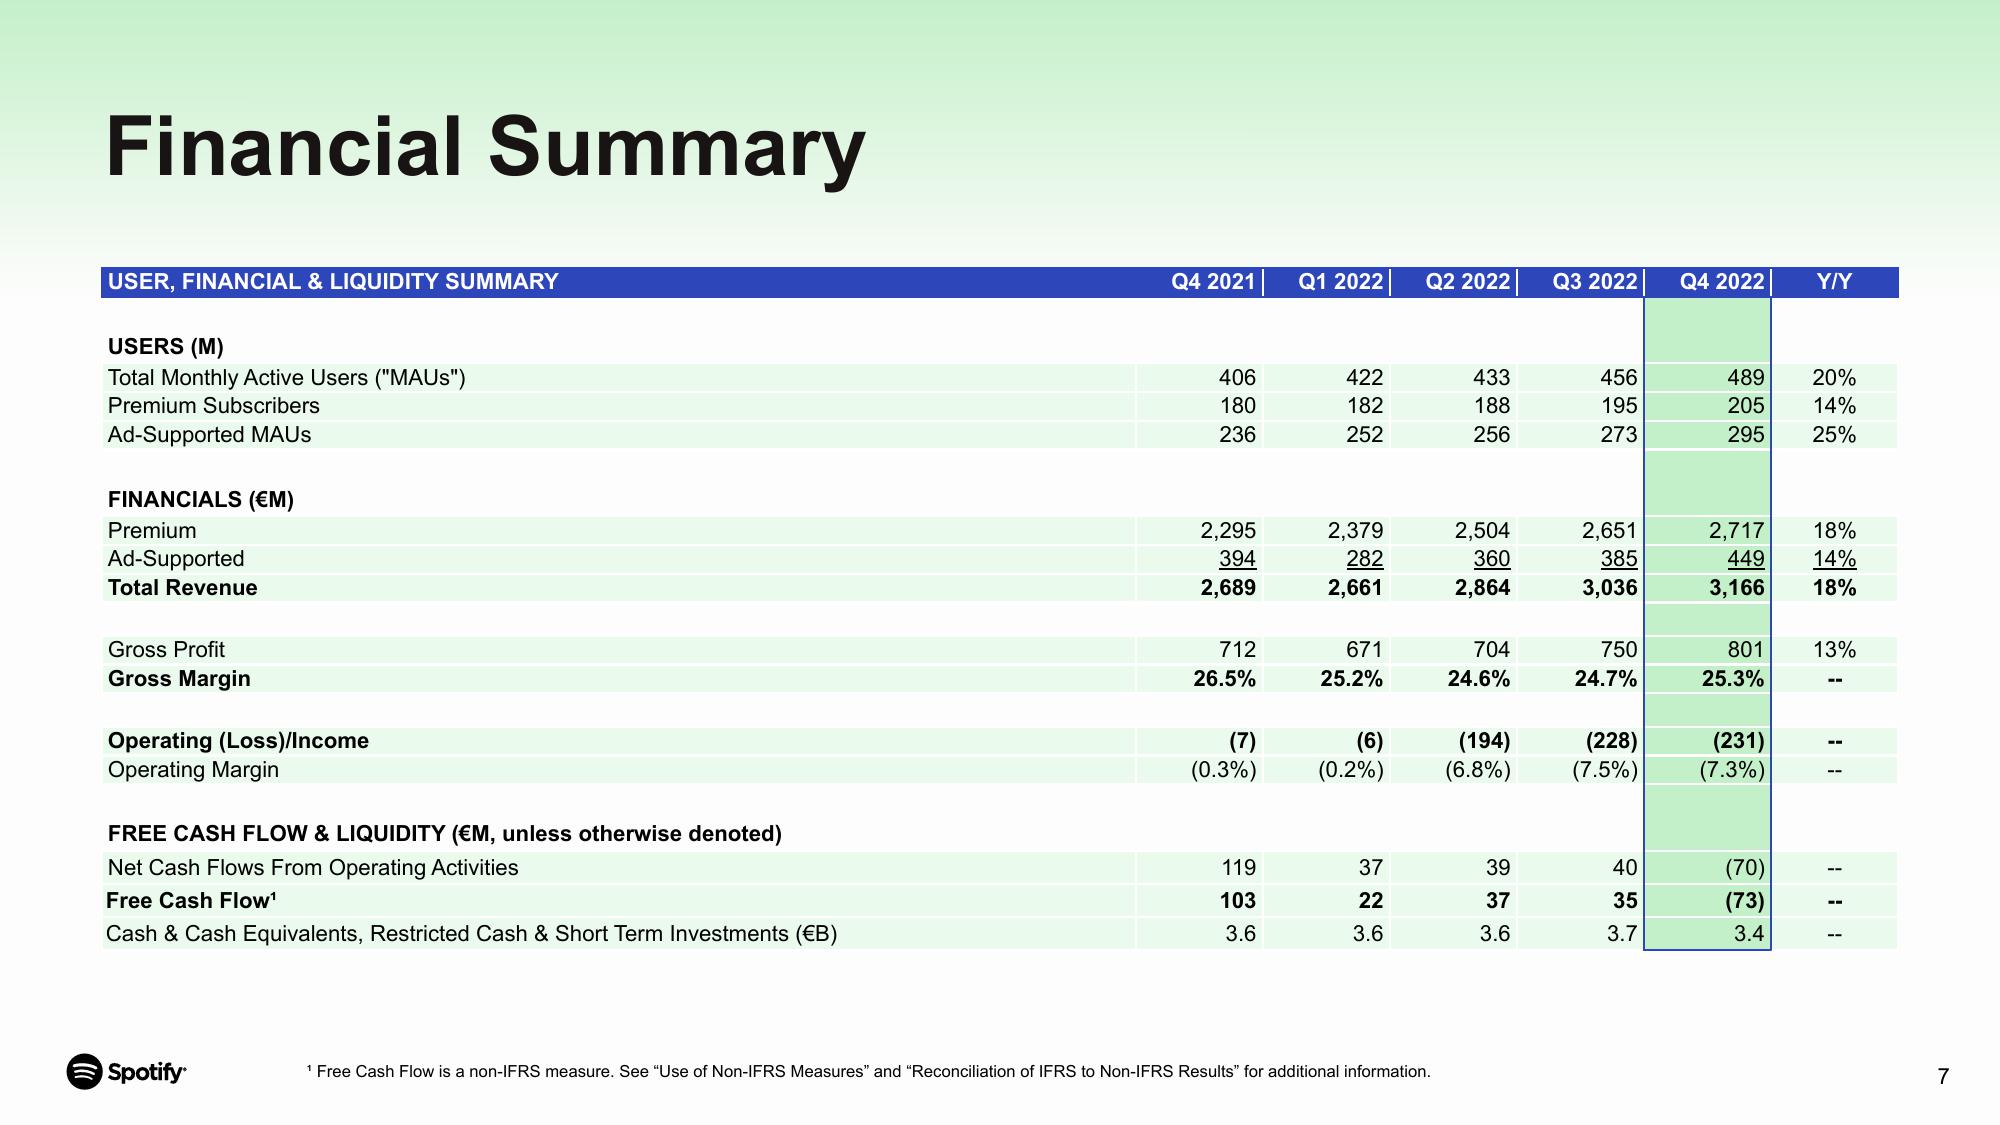
Financial Summary
USER, FINANCIAL & LIQUIDITY SUMMARY
USERS (M)
Total Monthly Active Users ("MAUS")
Premium Subscribers
Ad-Supported MAUS
FINANCIALS (€M)
Premium
Ad-Supported
Total Revenue
Gross Profit
Gross Margin
Operating (Loss)/Income
Operating Margin
FREE CASH FLOW & LIQUIDITY (EM, unless otherwise denoted)
Net Cash Flows From Operating Activities
Free Cash Flow¹
Cash & Cash Equivalents, Restricted Cash & Short Term Investments (EB)
Spotify
Q4 2021
406
180
236
2,295
394
2,689
712
26.5%
(7)
(0.3%)
119
103
3.6
Q1 2022
422
182
252
2,379
282
2,661
671
25.2%
(6)
(0.2%)
37
22
3.6
Q2 2022
¹ Free Cash Flow is a non-IFRS measure. See "Use of Non-IFRS Measures" and "Reconciliation of IFRS to Non-IFRS Results" for additional information.
433
188
256
2,504
360
2,864
704
24.6%
(194)
(6.8%)
39
37
3.6
Q3 2022
456
195
273
2,651
385
3,036
750
24.7%
(228)
(7.5%)
40
35
3.7
Q4 2022
489
205
295
2,717
449
3,166
801
25.3%
(231)
(7.3%)
(70)
(73)
3.4
Y/Y
20%
14%
25%
18%
14%
18%
13%
--
--
--
7View entire presentation