TPG Results Presentation Deck
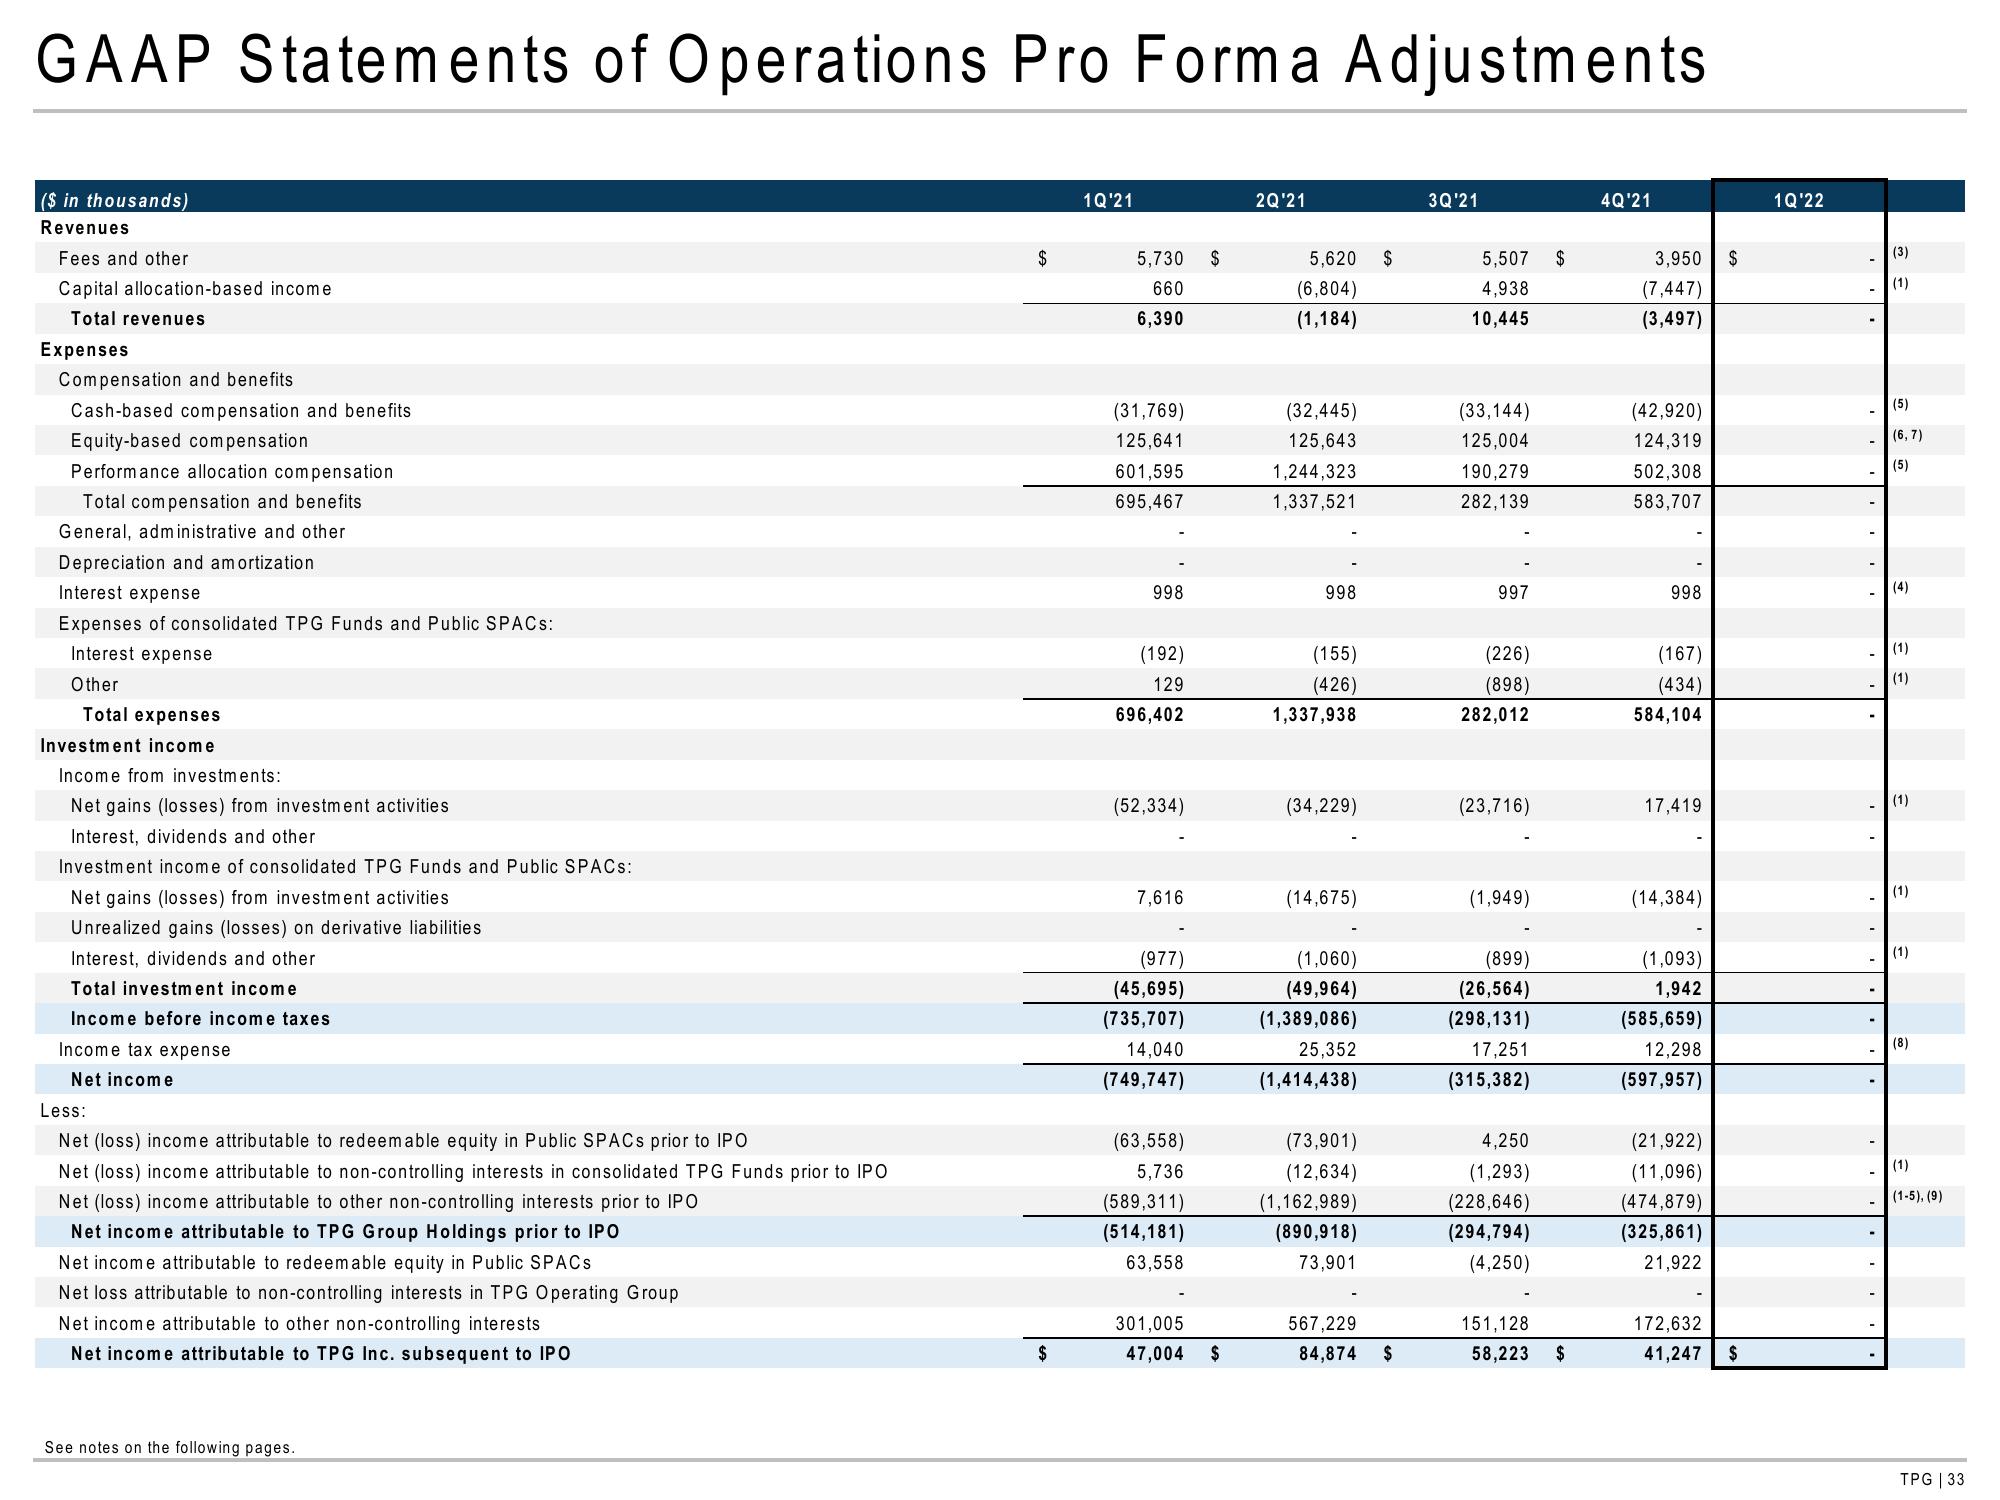
GAAP Statements of Operations Pro Forma Adjustments
($ in thousands)
Revenues
Fees and other
Capital allocation-based income
Total revenues
Expenses
Compensation and benefits
Cash-based compensation and benefits
Equity-based compensation
Performance allocation compensation
Total compensation and benefits
General, administrative and other
Depreciation and amortization
Interest expense
Expenses of consolidated TPG Funds and Public SPACs:
Interest expense
Other
Total expenses
Investment income
Income from investments:
Net gains (losses) from investment activities
Interest, dividends and other
Investment income of consolidated TPG Funds and Public SPACs:
Net gains (losses) from investment activities
Unrealized gains (losses) on derivative liabilities
Interest, dividends and other
Total investment income
Income before income taxes
Income tax expense
Net income
Less:
Net (loss) income attributable to redeemable equity in Public SPACs prior to IPO
Net (loss) income attributable to non-controlling interests in consolidated TPG Funds prior to IPO
Net (loss) income attributable to other non-controlling interests prior to IPO
Net income attributable to TPG Group Holdings prior to IPO
Net income attributable to redeemable equity in Public SPACs
Net loss attributable to non-controlling interests in TPG Operating Group
Net income attributable to other non-controlling interests
Net income attributable to TPG Inc. subsequent to IPO
See notes on the following pages.
$
1Q'21
5,730 $
660
6,390
(31,769)
125,641
601,595
695,467
998
(192)
129
696,402
(52,334)
7,616
(977)
(45,695)
(735,707)
14,040
(749,747)
(63,558)
5,736
(589,311)
(514,181)
63,558
301,005
47,004 $
2Q'21
5,620 $
(6,804)
(1,184)
(32,445)
125,643
1,244,323
1,337,521
998
(155)
(426)
1,337,938
(34,229)
(14,675)
(1,060)
(49,964)
(1,389,086)
25,352
(1,414,438)
(73,901)
(12,634)
(1,162,989)
(890,918)
73,901
567,229
84,874
$
3Q'21
5,507
4,938
10,445
(33,144)
125,004
190,279
282,139
997
(226)
(898)
282,012
(23,716)
(1,949)
(899)
(26,564)
(298,131)
17,251
(315,382)
4,250
(1,293)
(228,646)
(294,794)
(4,250)
151,128
58,223
$
$
4Q¹21
3,950 $
(7,447)
(3,497)
(42,920)
124,319
502,308
583,707
998
(167)
(434)
584,104
17,419
(14,384)
(1,093)
1,942
(585,659)
12,298
(597,957)
(21,922)
(11,096)
(474,879)
(325,861)
21,922
172,632
41,247 $
1Q'22
-
(3)
(1)
(5)
(6, 7)
(5)
(4)
(1)
(1)
(1)
(1)
(1)
(8)
(1)
(1-5), (9)
TPG | 33View entire presentation