Kinnevik Results Presentation Deck
Intro
Net Asset Value (SEK)
54.0bn
Key Financial Data
SEKM
Net Asset Value
Net Asset Value per Share, SEK
Share Price, SEK
Net Cash/ (Debt)
MAKING USE OF MARKET CONDITIONS TO ACCRETE
OWNERSHIP IN OUR
HIGHEST-CONVICTION BUSINESSES
SEKM
Net Asset Value
Net Profit/(Loss)
Net Profit /(Loss) per Share Pre Dilution, SEK
Net Profit / (Loss) per Share Post Dilution, SEK
Change in Fair Value of Financial Assets
Dividends Received
Dividend Paid
Investments
Divestments
KINNEVIK
Interim Report Q2 2023
Change in NAV Q/Q
(3)%
Q2 2023
-1 410
-5.02
-5.02
Portfolio Overview
-1 817
468
-11
2241
-10
30 Jun 2023
54 050
191.93
149.70
8 786
Q2 2022
-6 729
-24.09
-24.09
-9 701
3 077
475
-6 027
31 Mar 2023
55 460
198.02
154.55
10 506
H1 2023
1 136
4.05
4.05
742
468
-11
Change in NAVY/Y
(12)%
3 054
-1 030
31 Dec 2022
52 906
188.90
143.50
10 387
H1 2022
-11 270
-40.35
-40.35
-14 290
Sustainability
3 077
2 132
-7 042
30 Jun 2022
61 140
218.32
164.75
13 592
FY 2022
-19 519
-69.83
-69.83
-22 856
3 538
Financial Statements
5 742
-7 043
Other
One-Year TSR
(9)%
Five-Year Annualised TSR
+3%
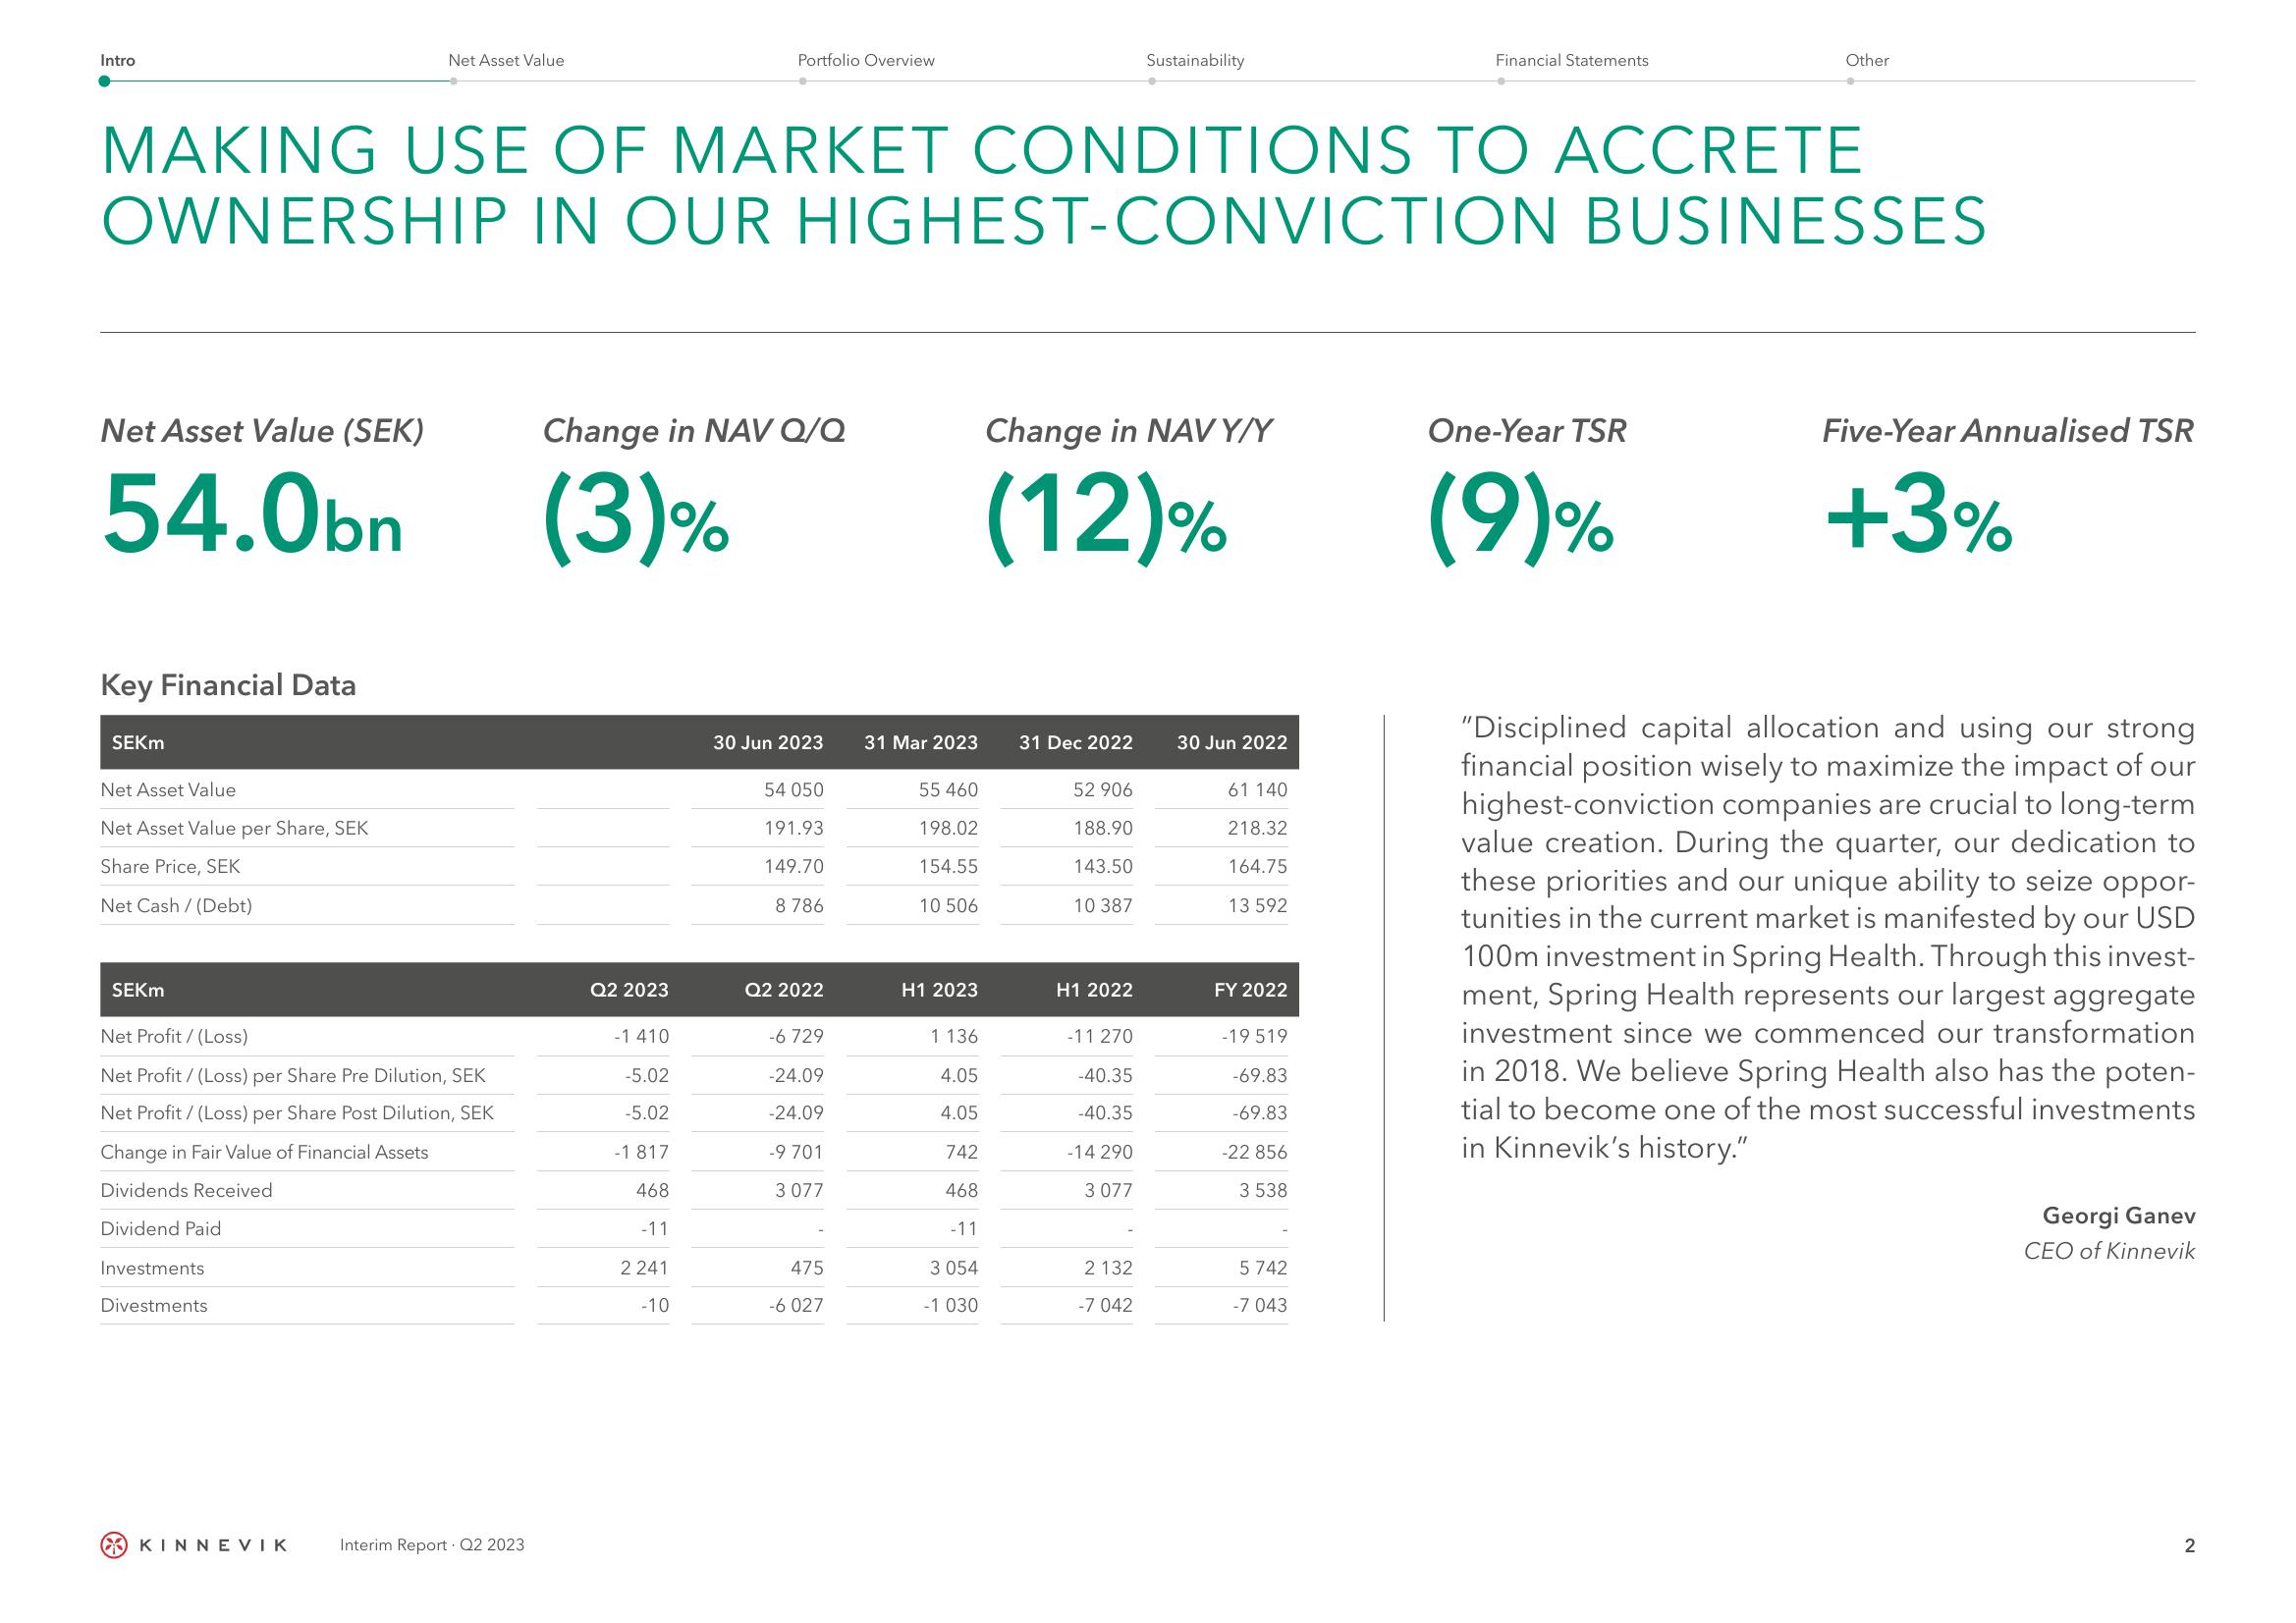
"Disciplined capital allocation and using our strong
financial position wisely to maximize the impact of our
highest-conviction companies are crucial to long-term
value creation. During the quarter, our dedication to
these priorities and our unique ability to seize oppor-
tunities in the current market is manifested by our USD
100m investment in Spring Health. Through this invest-
ment, Spring Health represents our largest aggregate
investment since we commenced our transformation
in 2018. We believe Spring Health also has the poten-
tial to become one of the most successful investments
in Kinnevik's history."
Georgi Ganev
CEO of Kinnevik
2View entire presentation