Paysafe Results Presentation Deck
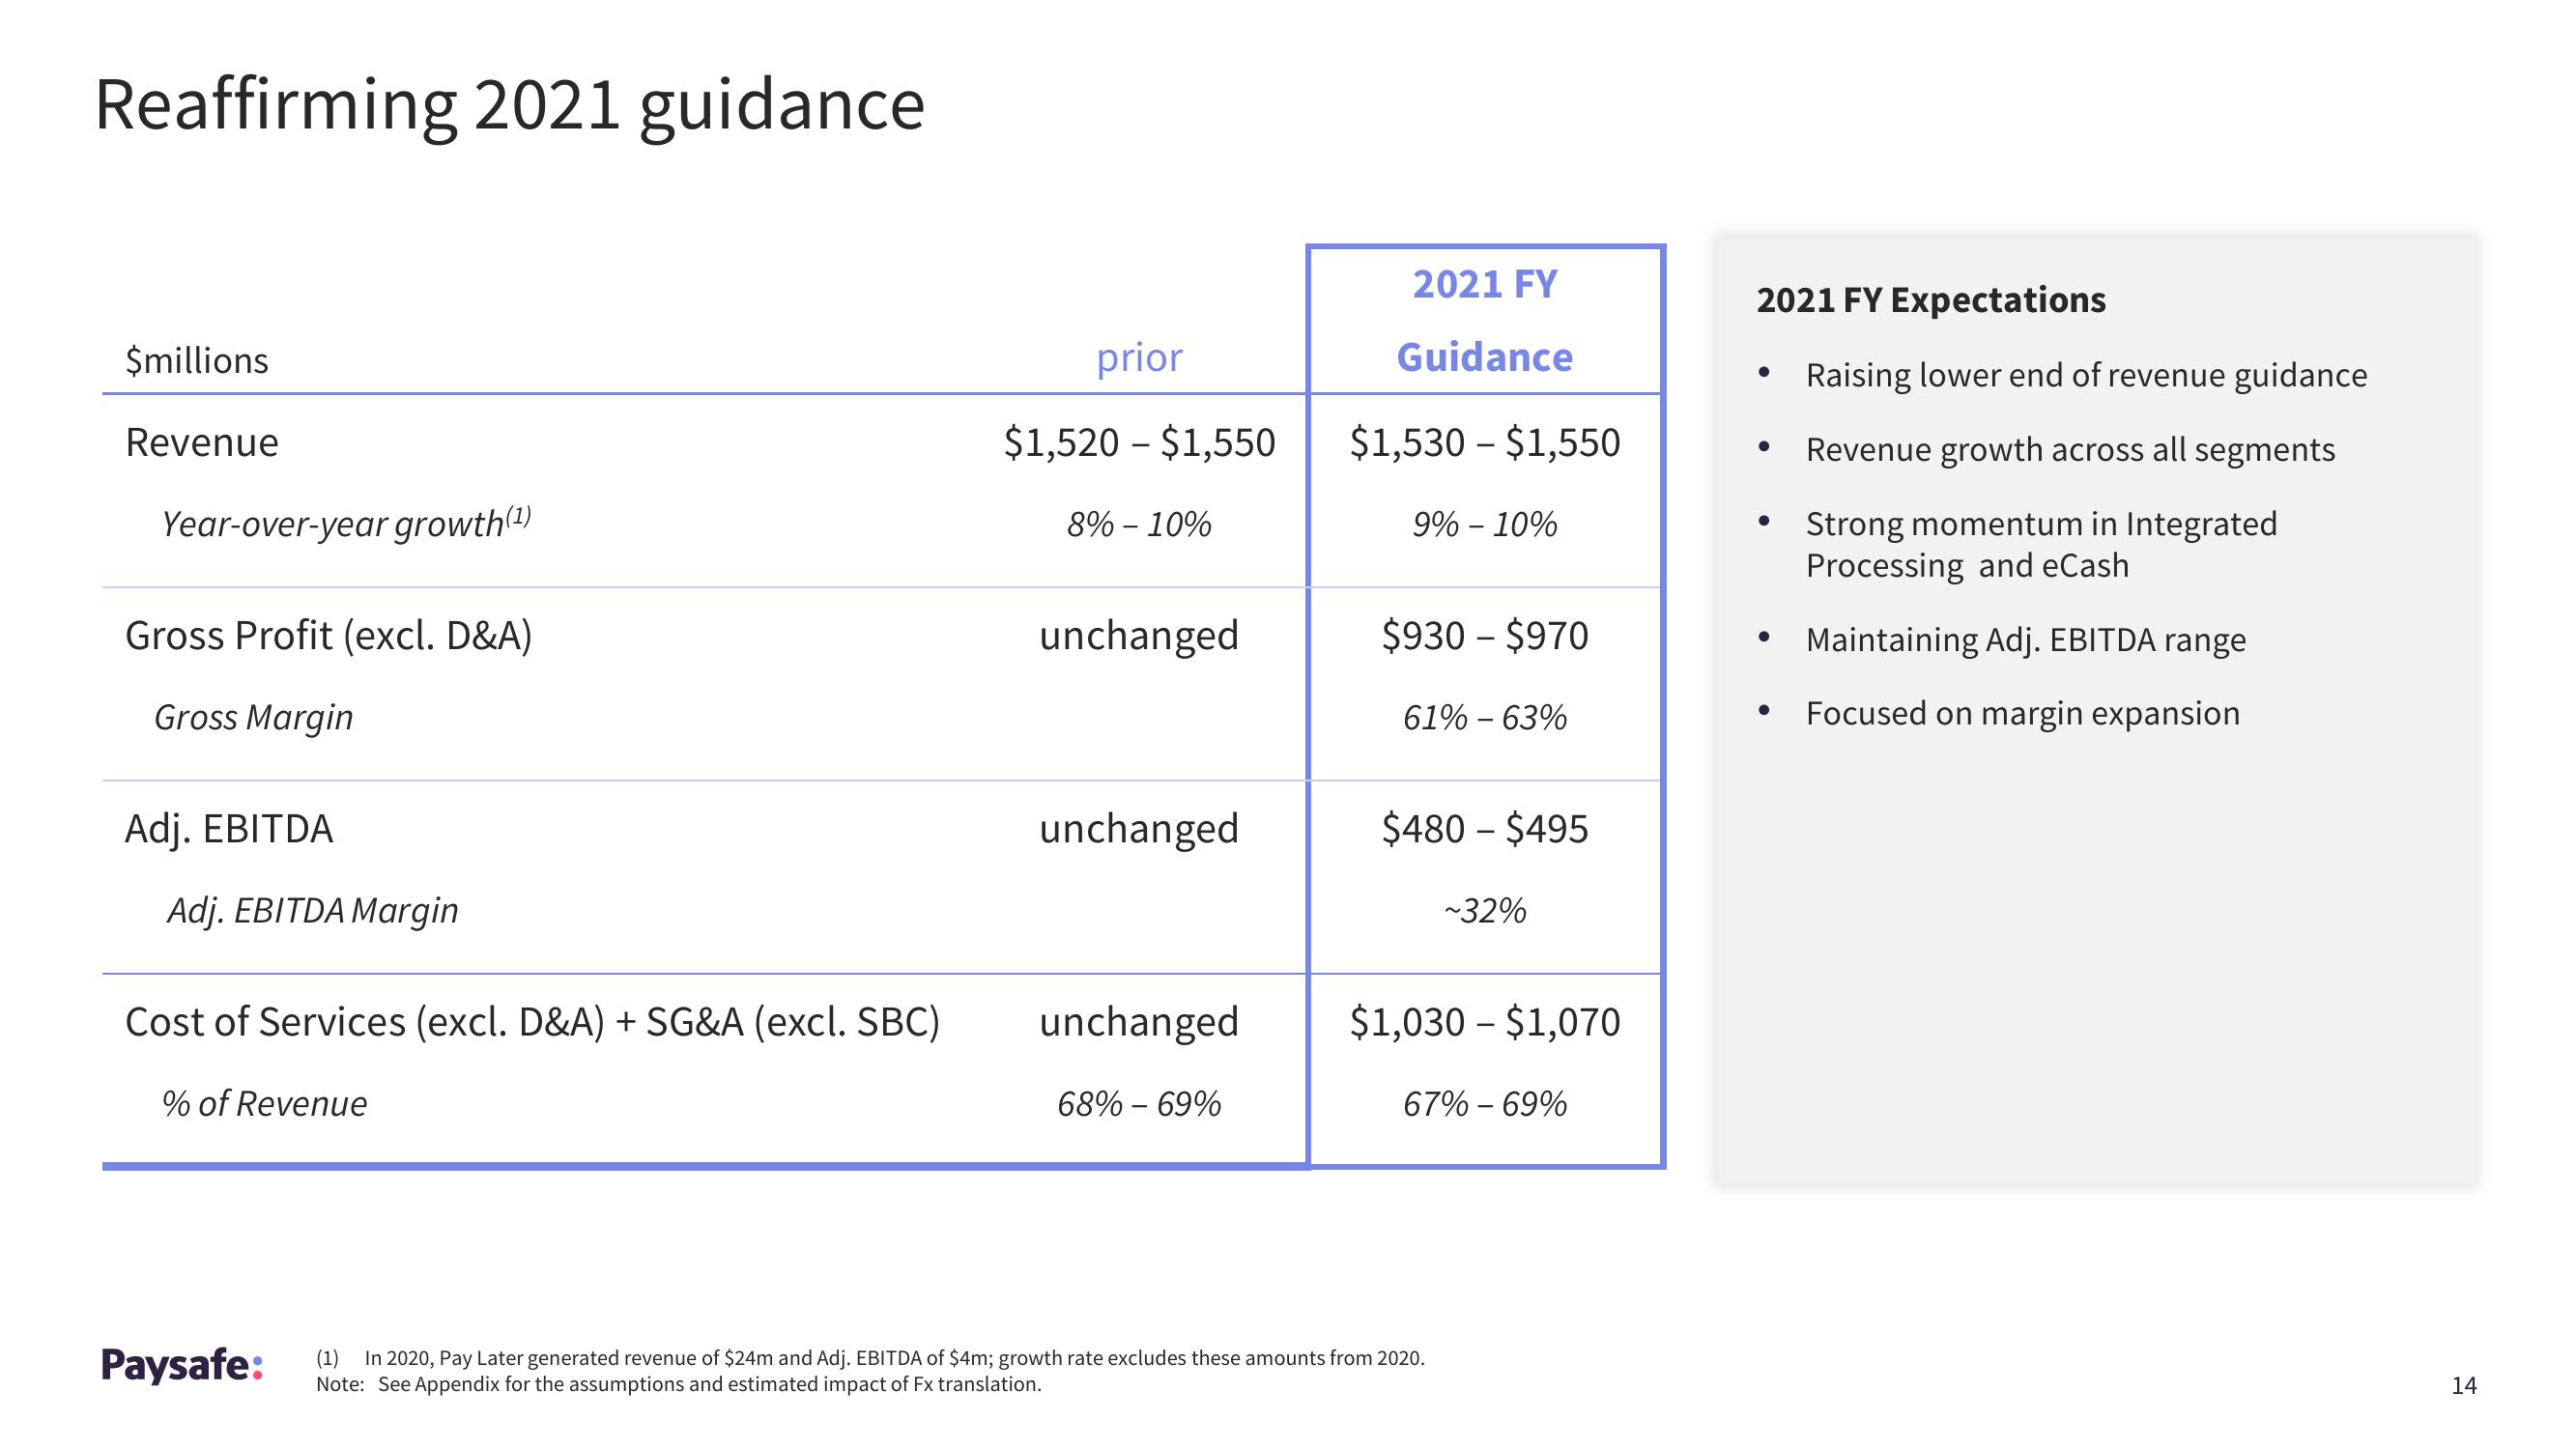
Reaffirming 2021 guidance
$millions
Revenue
Year-over-year growth(¹)
Gross Profit (excl. D&A)
Gross Margin
Adj. EBITDA
Adj. EBITDA Margin
Cost of Services (excl. D&A) + SG&A (excl. SBC)
% of Revenue
Paysafe:
prior
$1,520 - $1,550
8% - 10%
unchanged
unchanged
unchanged
68% -69%
2021 FY
Guidance
$1,530 - $1,550
9% - 10%
$930 - $970
61% -63%
$480 - $495
~32%
$1,030 - $1,070
67% -69%
(1) In 2020, Pay Later generated revenue of $24m and Adj. EBITDA of $4m; growth rate excludes these amounts from 2020.
Note: See Appendix for the assumptions and estimated impact of Fx translation.
2021 FY Expectations
Raising lower end of revenue guidance
Revenue growth across all segments
Strong momentum in Integrated
Processing and eCash
Maintaining Adj. EBITDA range
Focused on margin expansion
●
●
14View entire presentation