Uber Results Presentation Deck
Continued:
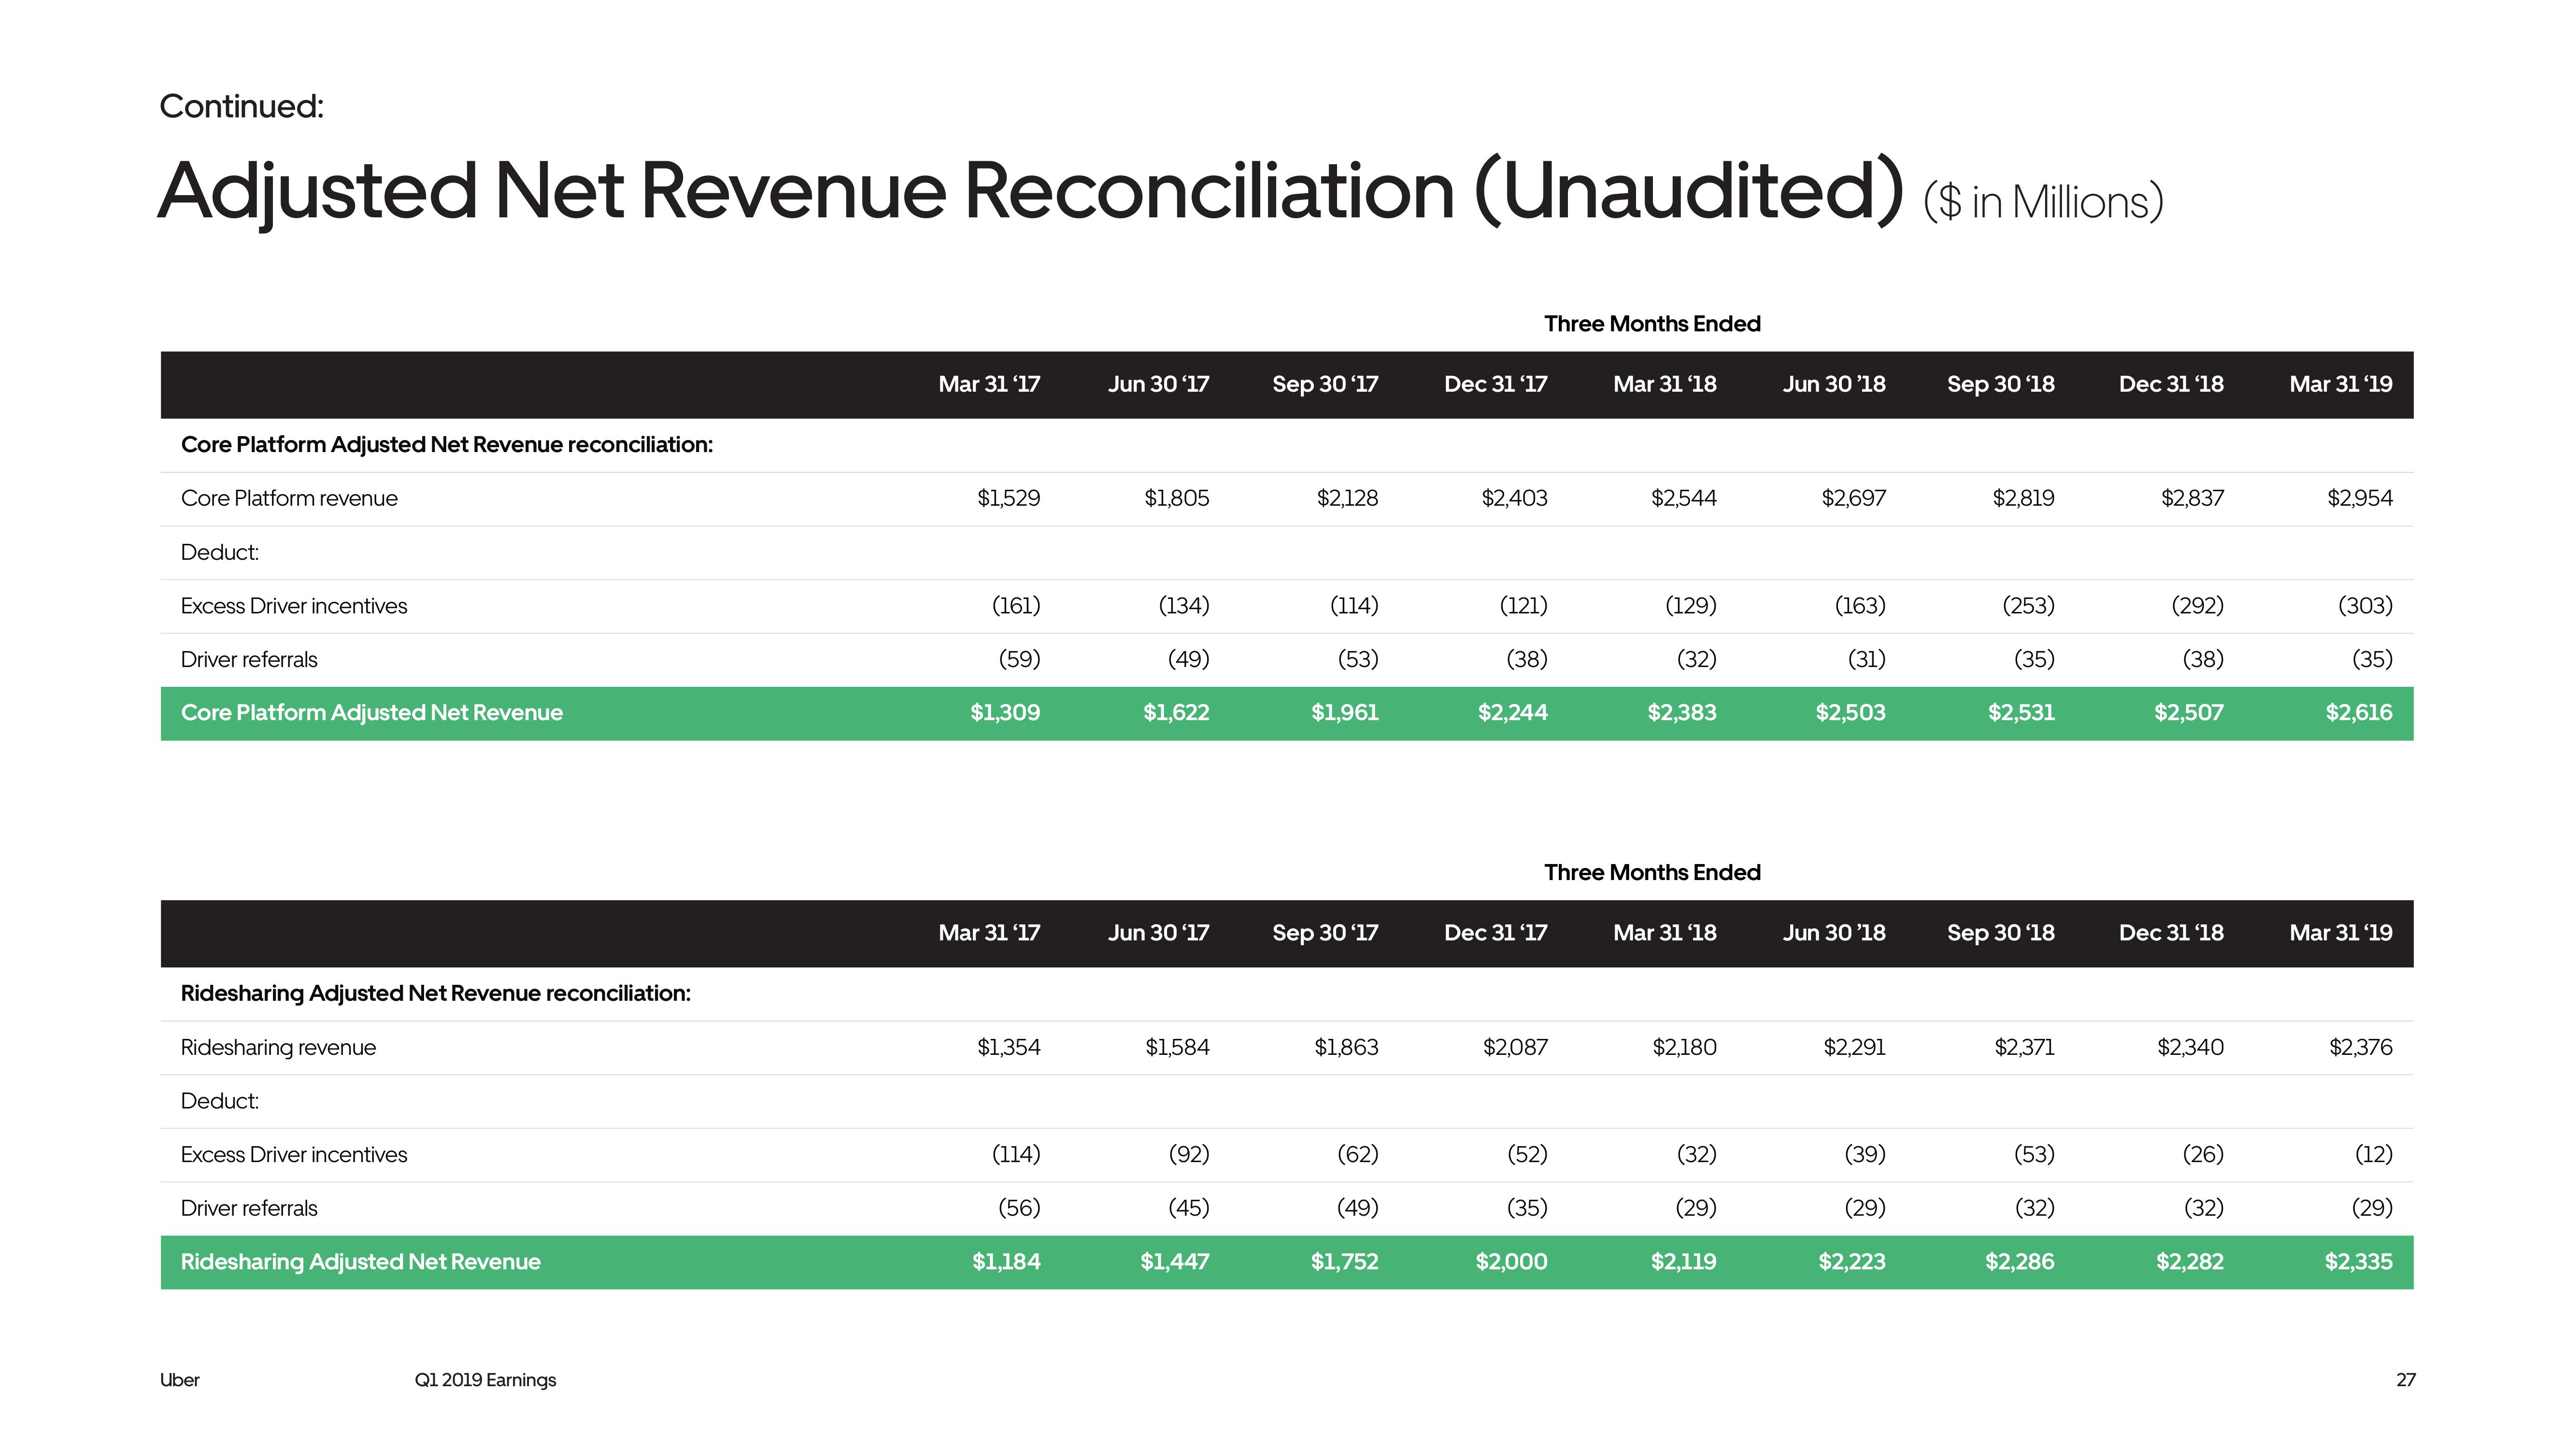
Adjusted Net Revenue Reconciliation (Unaudited) ($in Millions)
Core Platform Adjusted Net Revenue reconciliation:
Core Platform revenue
Deduct:
Excess Driver incentives
Driver referrals
Core Platform Adjusted Net Revenue
Ridesharing Adjusted Net Revenue reconciliation:
Ridesharing revenue
Deduct:
Excess Driver incentives
Driver referrals
Ridesharing Adjusted Net Revenue
Uber
Q1 2019 Earnings
Mar 31 '17
$1,529
(161)
(59)
$1,309
Mar 31 '17
$1,354
(114)
(56)
$1,184
Jun 30 '17
$1,805
(134)
(49)
$1,622
Jun 30 '17
$1,584
(92)
(45)
$1,447
Sep 30 '17
$2,128
(114)
(53)
$1,961
Sep 30 '17
$1,863
(62)
(49)
$1,752
Three Months Ended
Dec 31 '17
$2,403
(121)
(38)
$2,244
Dec 31 '17
$2,087
Mar 31 '18
Three Months Ended
(52)
(35)
$2,000
$2,544
(129)
(32)
$2,383
Mar 31 '18
$2,180
(32)
(29)
$2,119
Jun 30'18
$2,697
(163)
(31)
$2,503
Jun 30'18
$2,291
(39)
(29)
$2,223
Sep 30 '18
$2,819
(253)
(35)
$2,531
Sep 30'18
$2,371
(53)
(32)
$2,286
Dec 31 '18
$2,837
(292)
(38)
$2,507
Dec 31 '18
$2,340
(26)
(32)
$2,282
Mar 31 '19
$2,954
(303)
(35)
$2,616
Mar 31 '19
$2,376
(12)
(29)
$2,335
27View entire presentation