AMD Results Presentation Deck
APPENDICES
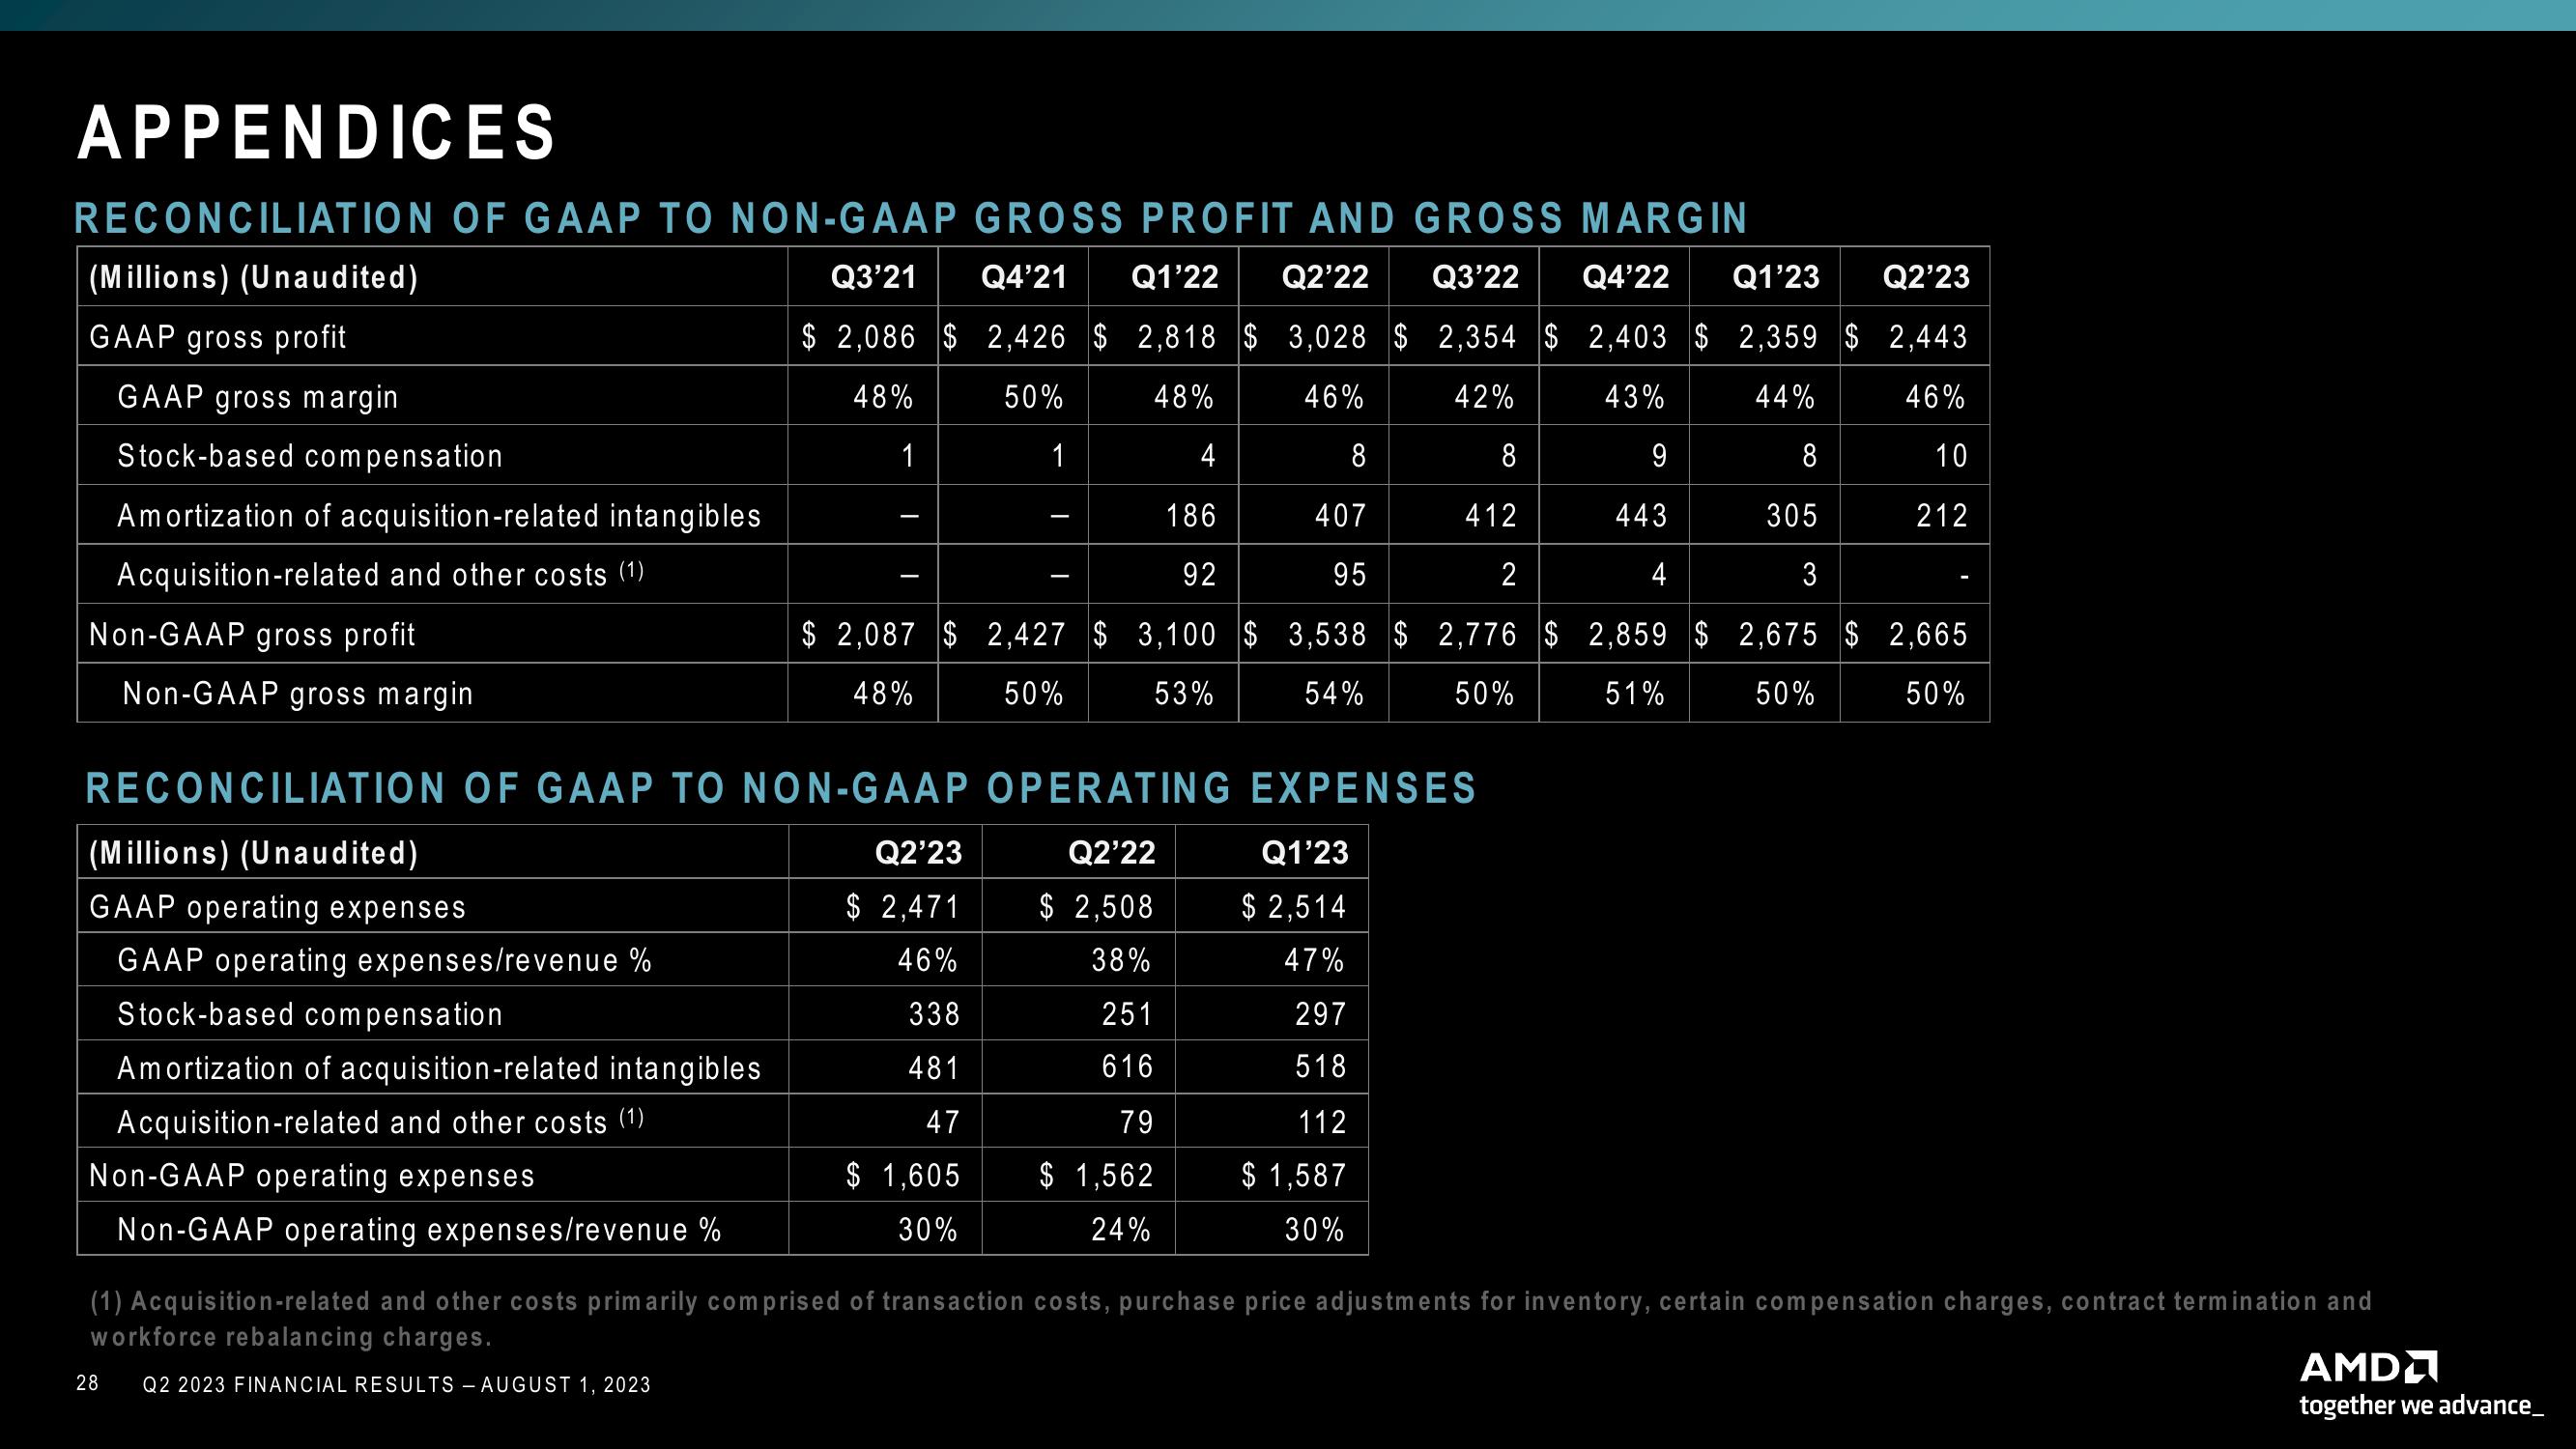
RECONCILIATION OF GAAP TO NON-GAAP GROSS PROFIT AND GROSS MARGIN
Q4'21 Q1'22 Q2'22 Q3'22 Q4'22 Q1'23 Q2'23
$ 2,086 $ 2,426 $ 2,818 $ 3,028 $ 2,354 $ 2,403 $ 2,359 $2,443
Q3'21
48%
50%
48%
46%
42%
43%
44%
46%
1
8
8
9
8
10
407
412
443
305
212
95
2
4
3
3,538 $ 2,776 $ 2,859 $ 2,675 $ 2,665
54%
50%
51%
50%
50%
(Millions) (Unaudited)
GAAP gross profit
GAAP gross margin
Stock-based compensation
Amortization of acquisition-related intangibles
Acquisition-related and other costs (1)
Non-GAAP gross profit
Non-GAAP gross margin
(Millions) (Unaudited)
GAAP operating expenses
GAAP operating expenses/revenue %
28
Stock-based compensation
Amortization of acquisition-related intangibles
Acquisition-related and other costs (1)
Non-GAAP operating expenses
Non-GAAP operating expenses/revenue %
4
186
92
$ 2,087 $2,427 $ 3,100 $
48%
50%
53%
1
RECONCILIATION OF GAAP TO NON-GAAP
—
I
Q2'23
$ 2,471
46%
338
481
47
$ 1,605
30%
OPERATING
Q2'22
$ 2,508
38%
251
616
79
$ 1,562
24%
EXPENSES
Q1'23
$2,514
47%
297
518
112
$ 1,587
30%
(1) Acquisition-related and other costs primarily comprised of transaction costs, purchase price adjustments for inventory, certain compensation charges, contract termination and
workforce rebalancing charges.
Q2 2023 FINANCIAL RESULTS - AUGUST 1, 2023
AMD
together we advance_View entire presentation