Kinnevik Results Presentation Deck
Intro
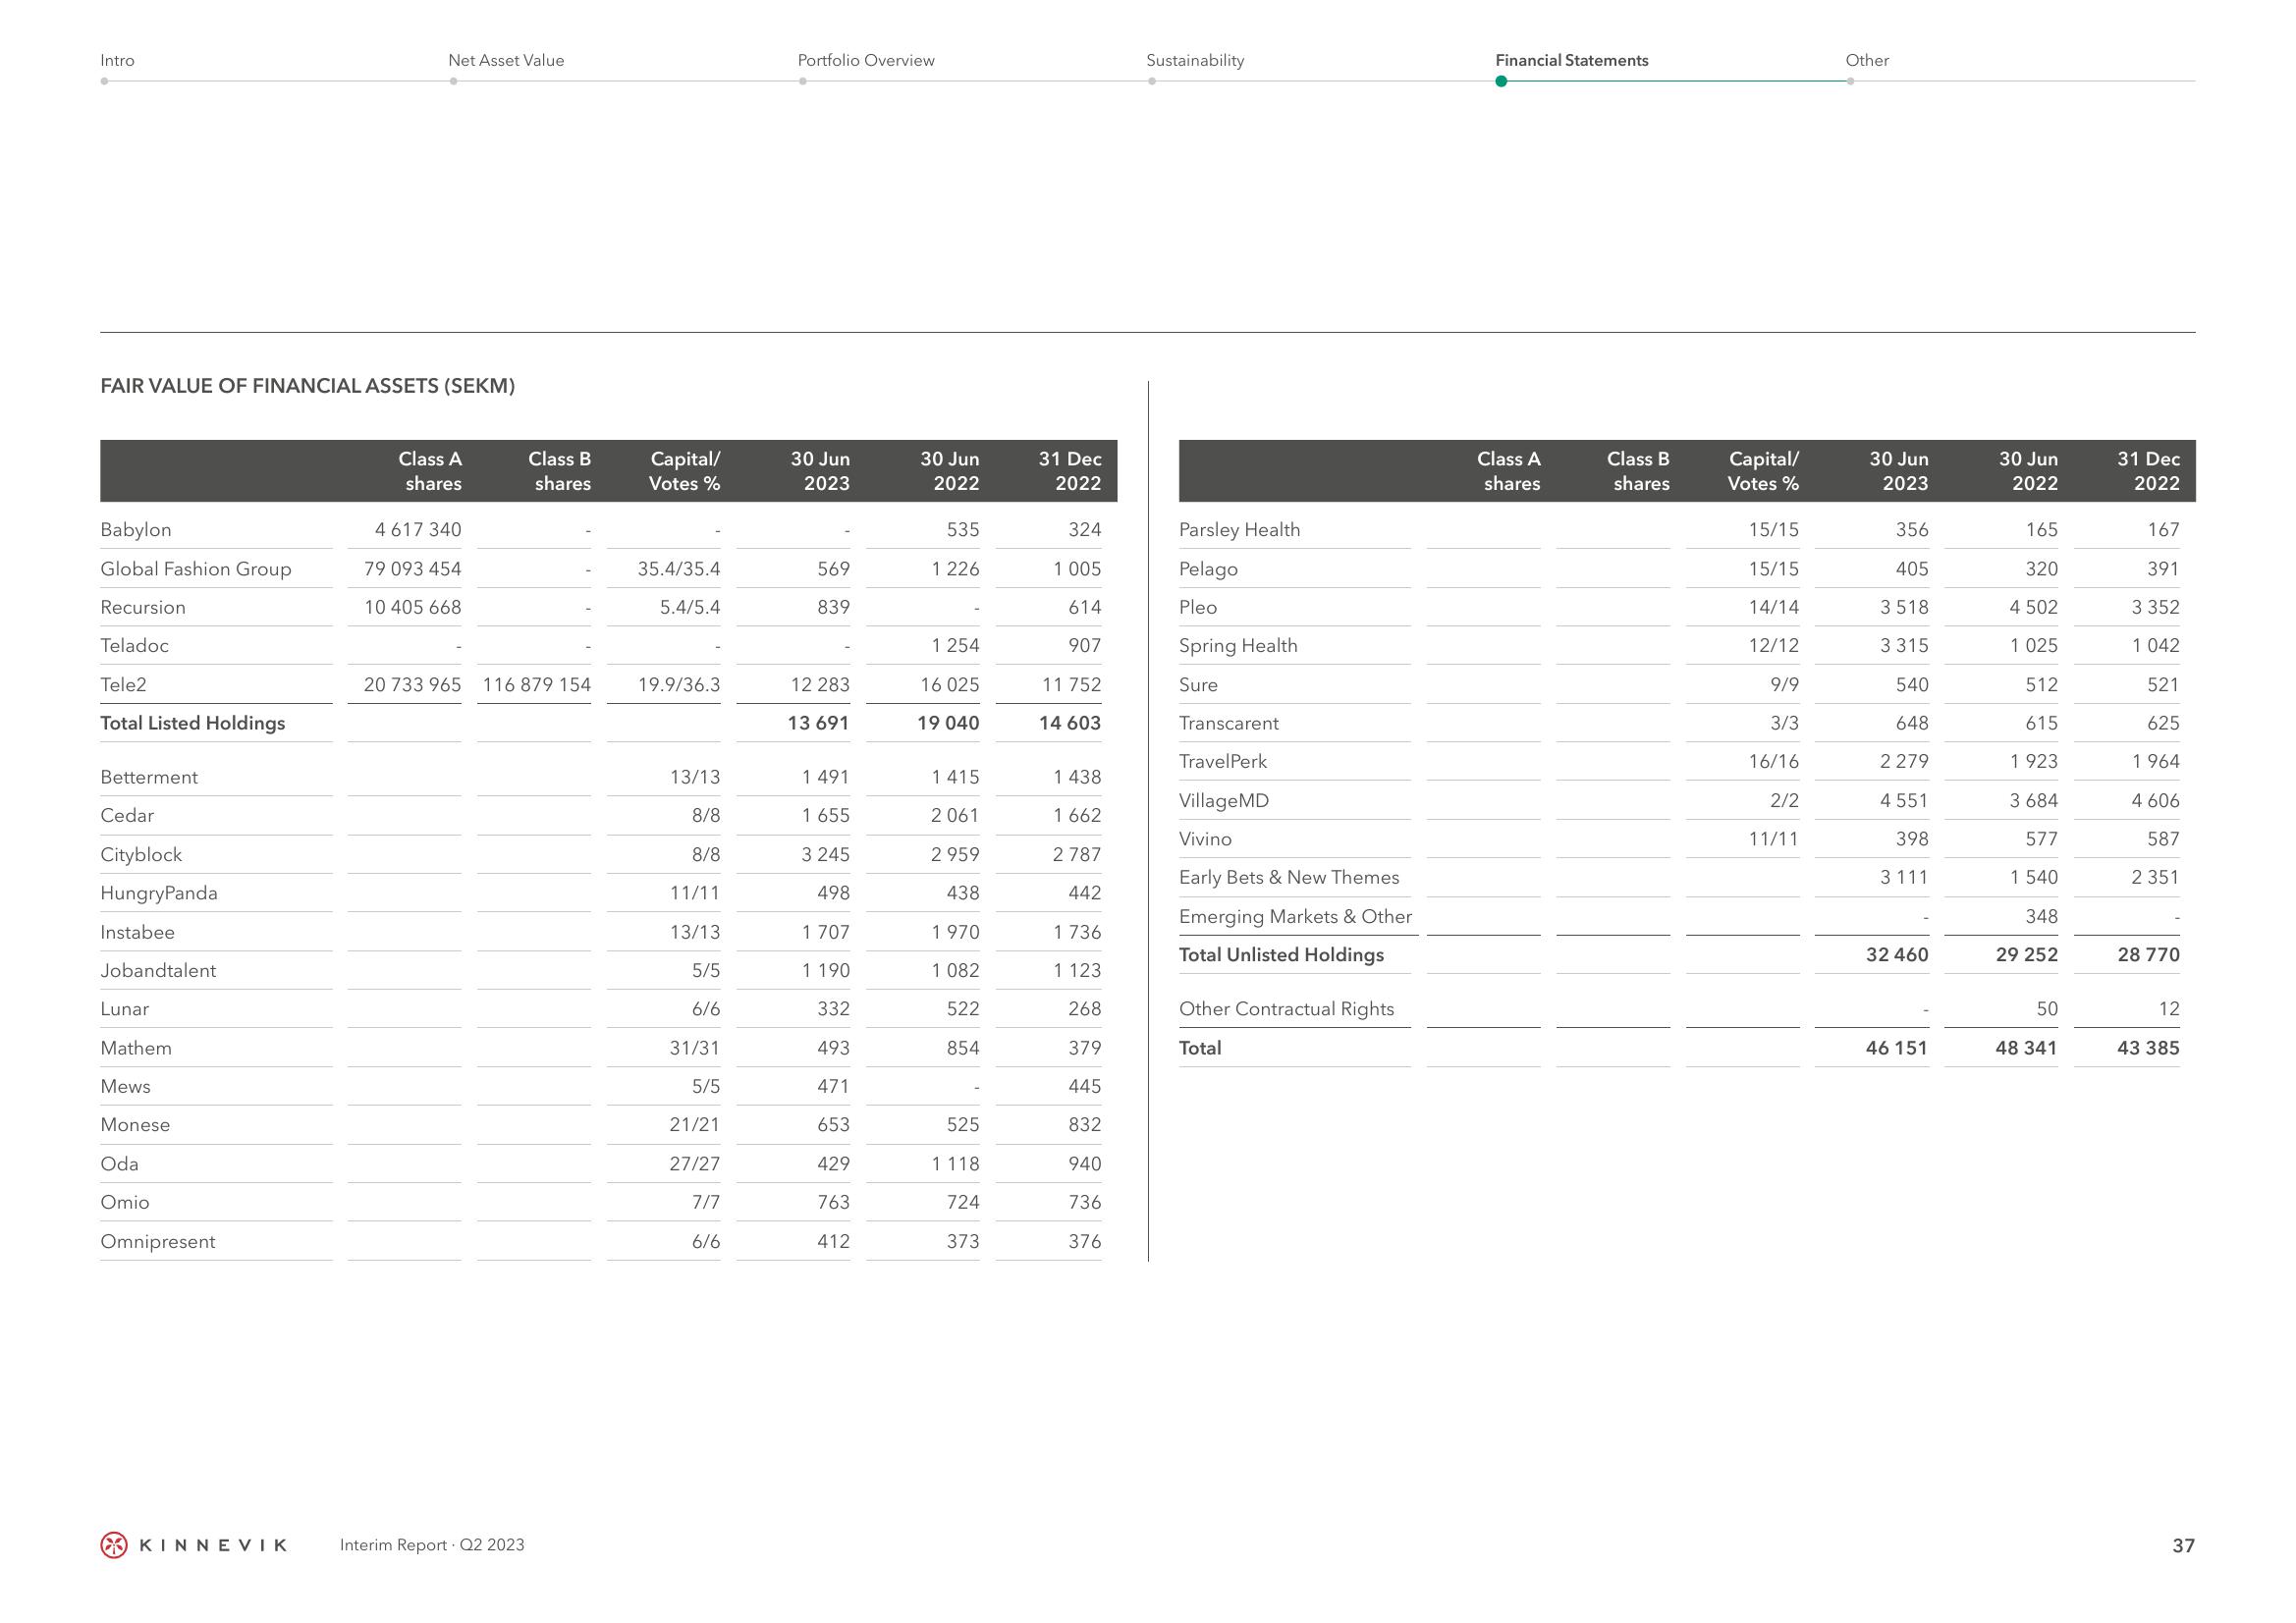
FAIR VALUE OF FINANCIAL ASSETS (SEKM)
Babylon
Global Fashion Group
Recursion
Teladoc
Tele2
Total Listed Holdings
Betterment
Cedar
Cityblock
HungryPanda
Instabee
Jobandtalent
Lunar
Mathem
Mews
Monese
Oda
Omio
Omnipresent
Net Asset Value
KINNEVIK
Class A
shares
4 617 340
79 093 454
10 405 668
Class B
shares
20 733 965 116 879 154
Interim Report Q2 2023
Capital/
Votes %
35.4/35.4
5.4/5.4
19.9/36.3
13/13
8/8
8/8
11/11
13/13
5/5
6/6
31/31
5/5
21/21
27/27
7/7
6/6
Portfolio Overview
30 Jun
2023
569
839
12 283
13 691
1 491
1 655
3 245
498
1 707
1 190
332
493
471
653
429
763
412
30 Jun
2022
535
1 226
1 254
16 025
19 040
1415
2 061
2 959
438
1970
1 082
522
854
525
1118
724
373
31 Dec
2022
324
1 005
614
907
11 752
14 603
1 438
1 662
2 787
442
1 736
1 123
268
379
445
832
940
736
376
Sustainability
Parsley Health
Pelago
Pleo
Spring Health
Sure
Transcarent
TravelPerk
Village MD
Vivino
Early Bets & New Themes
Emerging Markets & Other
Total Unlisted Holdings
Other Contractual Rights
Total
Financial Statements
Class A
shares
Class B
shares
Capital/
Votes %
15/15
15/15
14/14
12/12
9/9
3/3
16/16
2/2
11/11
Other
30 Jun
2023
356
405
3518
3 315
540
648
2 279
4 551
398
3111
32 460
46 151
30 Jun
2022
165
320
4 502
1 025
512
615
1923
3 684
577
1 540
348
29 252
50
48 341
31 Dec
2022
167
391
3 352
1 042
521
625
1964
4 606
587
2 351
28 770
12
43 385
37View entire presentation