Summit Hotel Properties Investor Presentation Deck
9
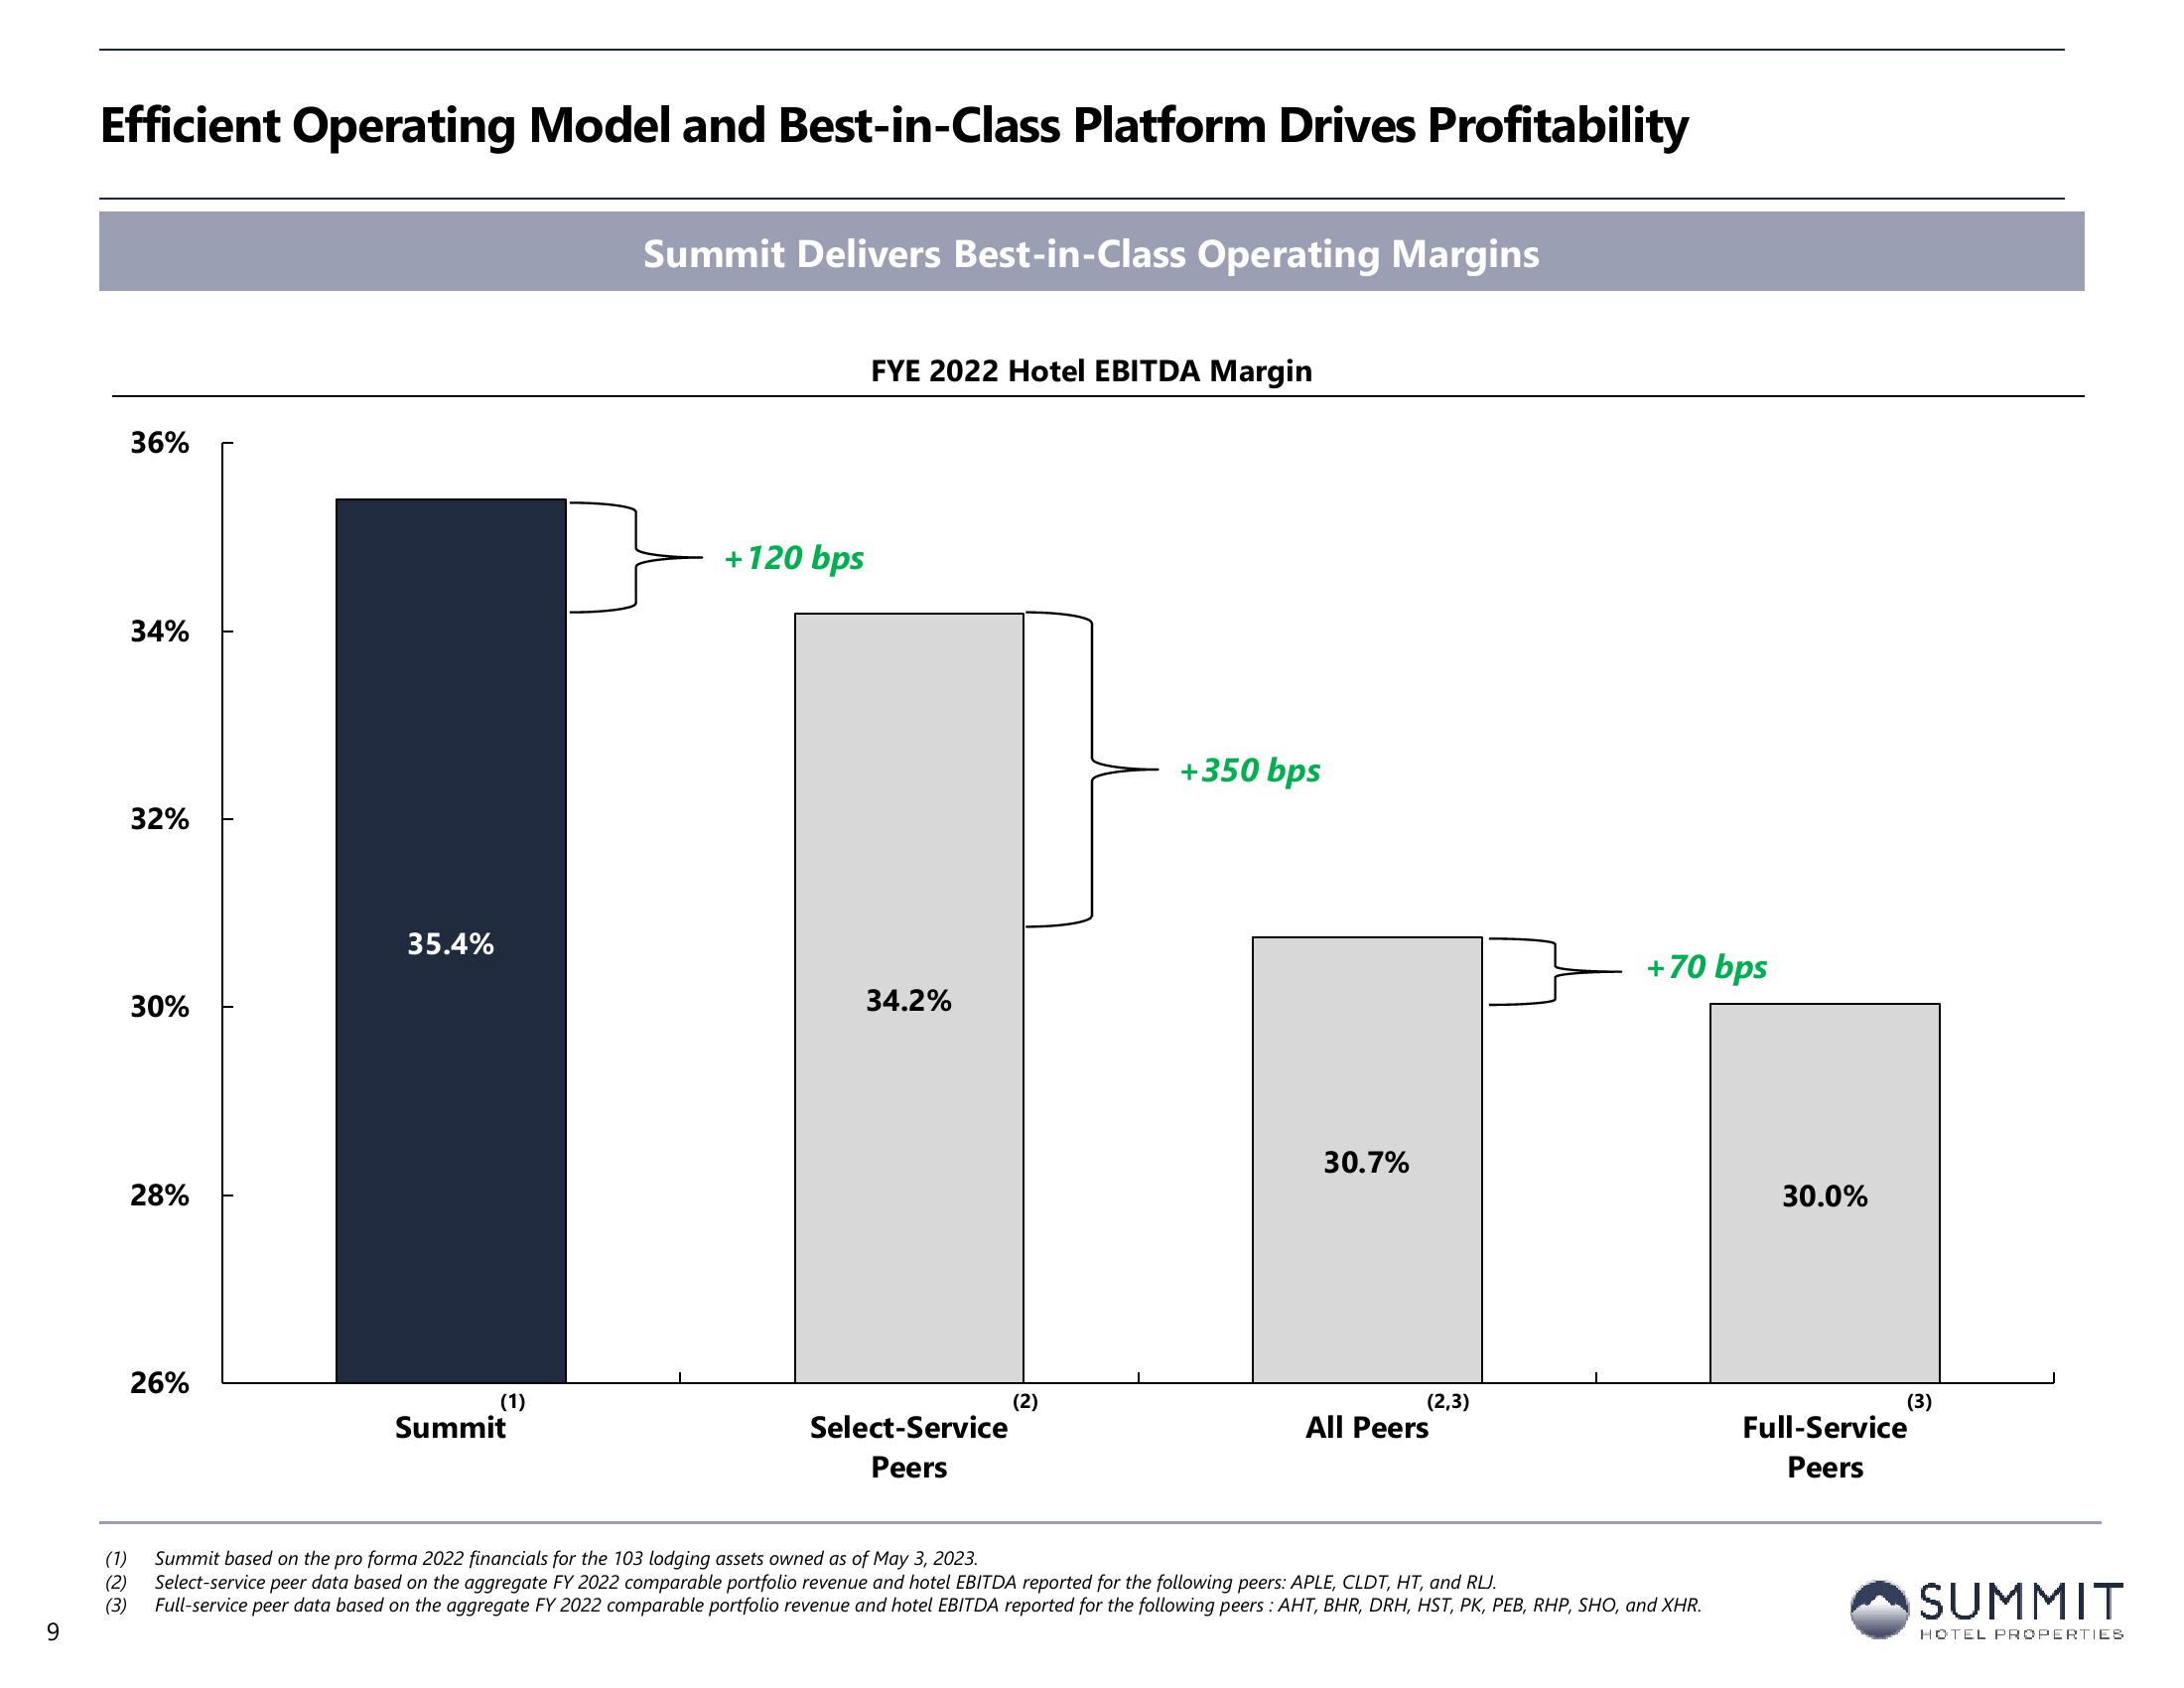
Efficient Operating Model and Best-in-Class Platform Drives Profitability
36%
34%
32%
30%
28%
26%
35.4%
(1)
Summit
Summit Delivers Best-in-Class Operating Margins
+120 bps
FYE 2022 Hotel EBITDA Margin
34.2%
Select-Service
Peers
(2)
+350 bps
30.7%
(2,3)
All Peers
+70 bps
(1) Summit based on the pro forma 2022 financials for the 103 lodging assets owned as of May 3, 2023.
(2) Select-service peer data based on the aggregate FY 2022 comparable portfolio revenue and hotel EBITDA reported for the following peers: APLE, CLDT, HT, and RLJ.
(3) Full-service peer data based on the aggregate FY 2022 comparable portfolio revenue and hotel EBITDA reported for the following peers: AHT, BHR, DRH, HST, PK, PEB, RHP, SHO, and XHR.
30.0%
(3)
Full-Service
Peers
SUMMIT
HOTEL PROPERTIESView entire presentation