XP Inc Results Presentation Deck
1
I
I
I
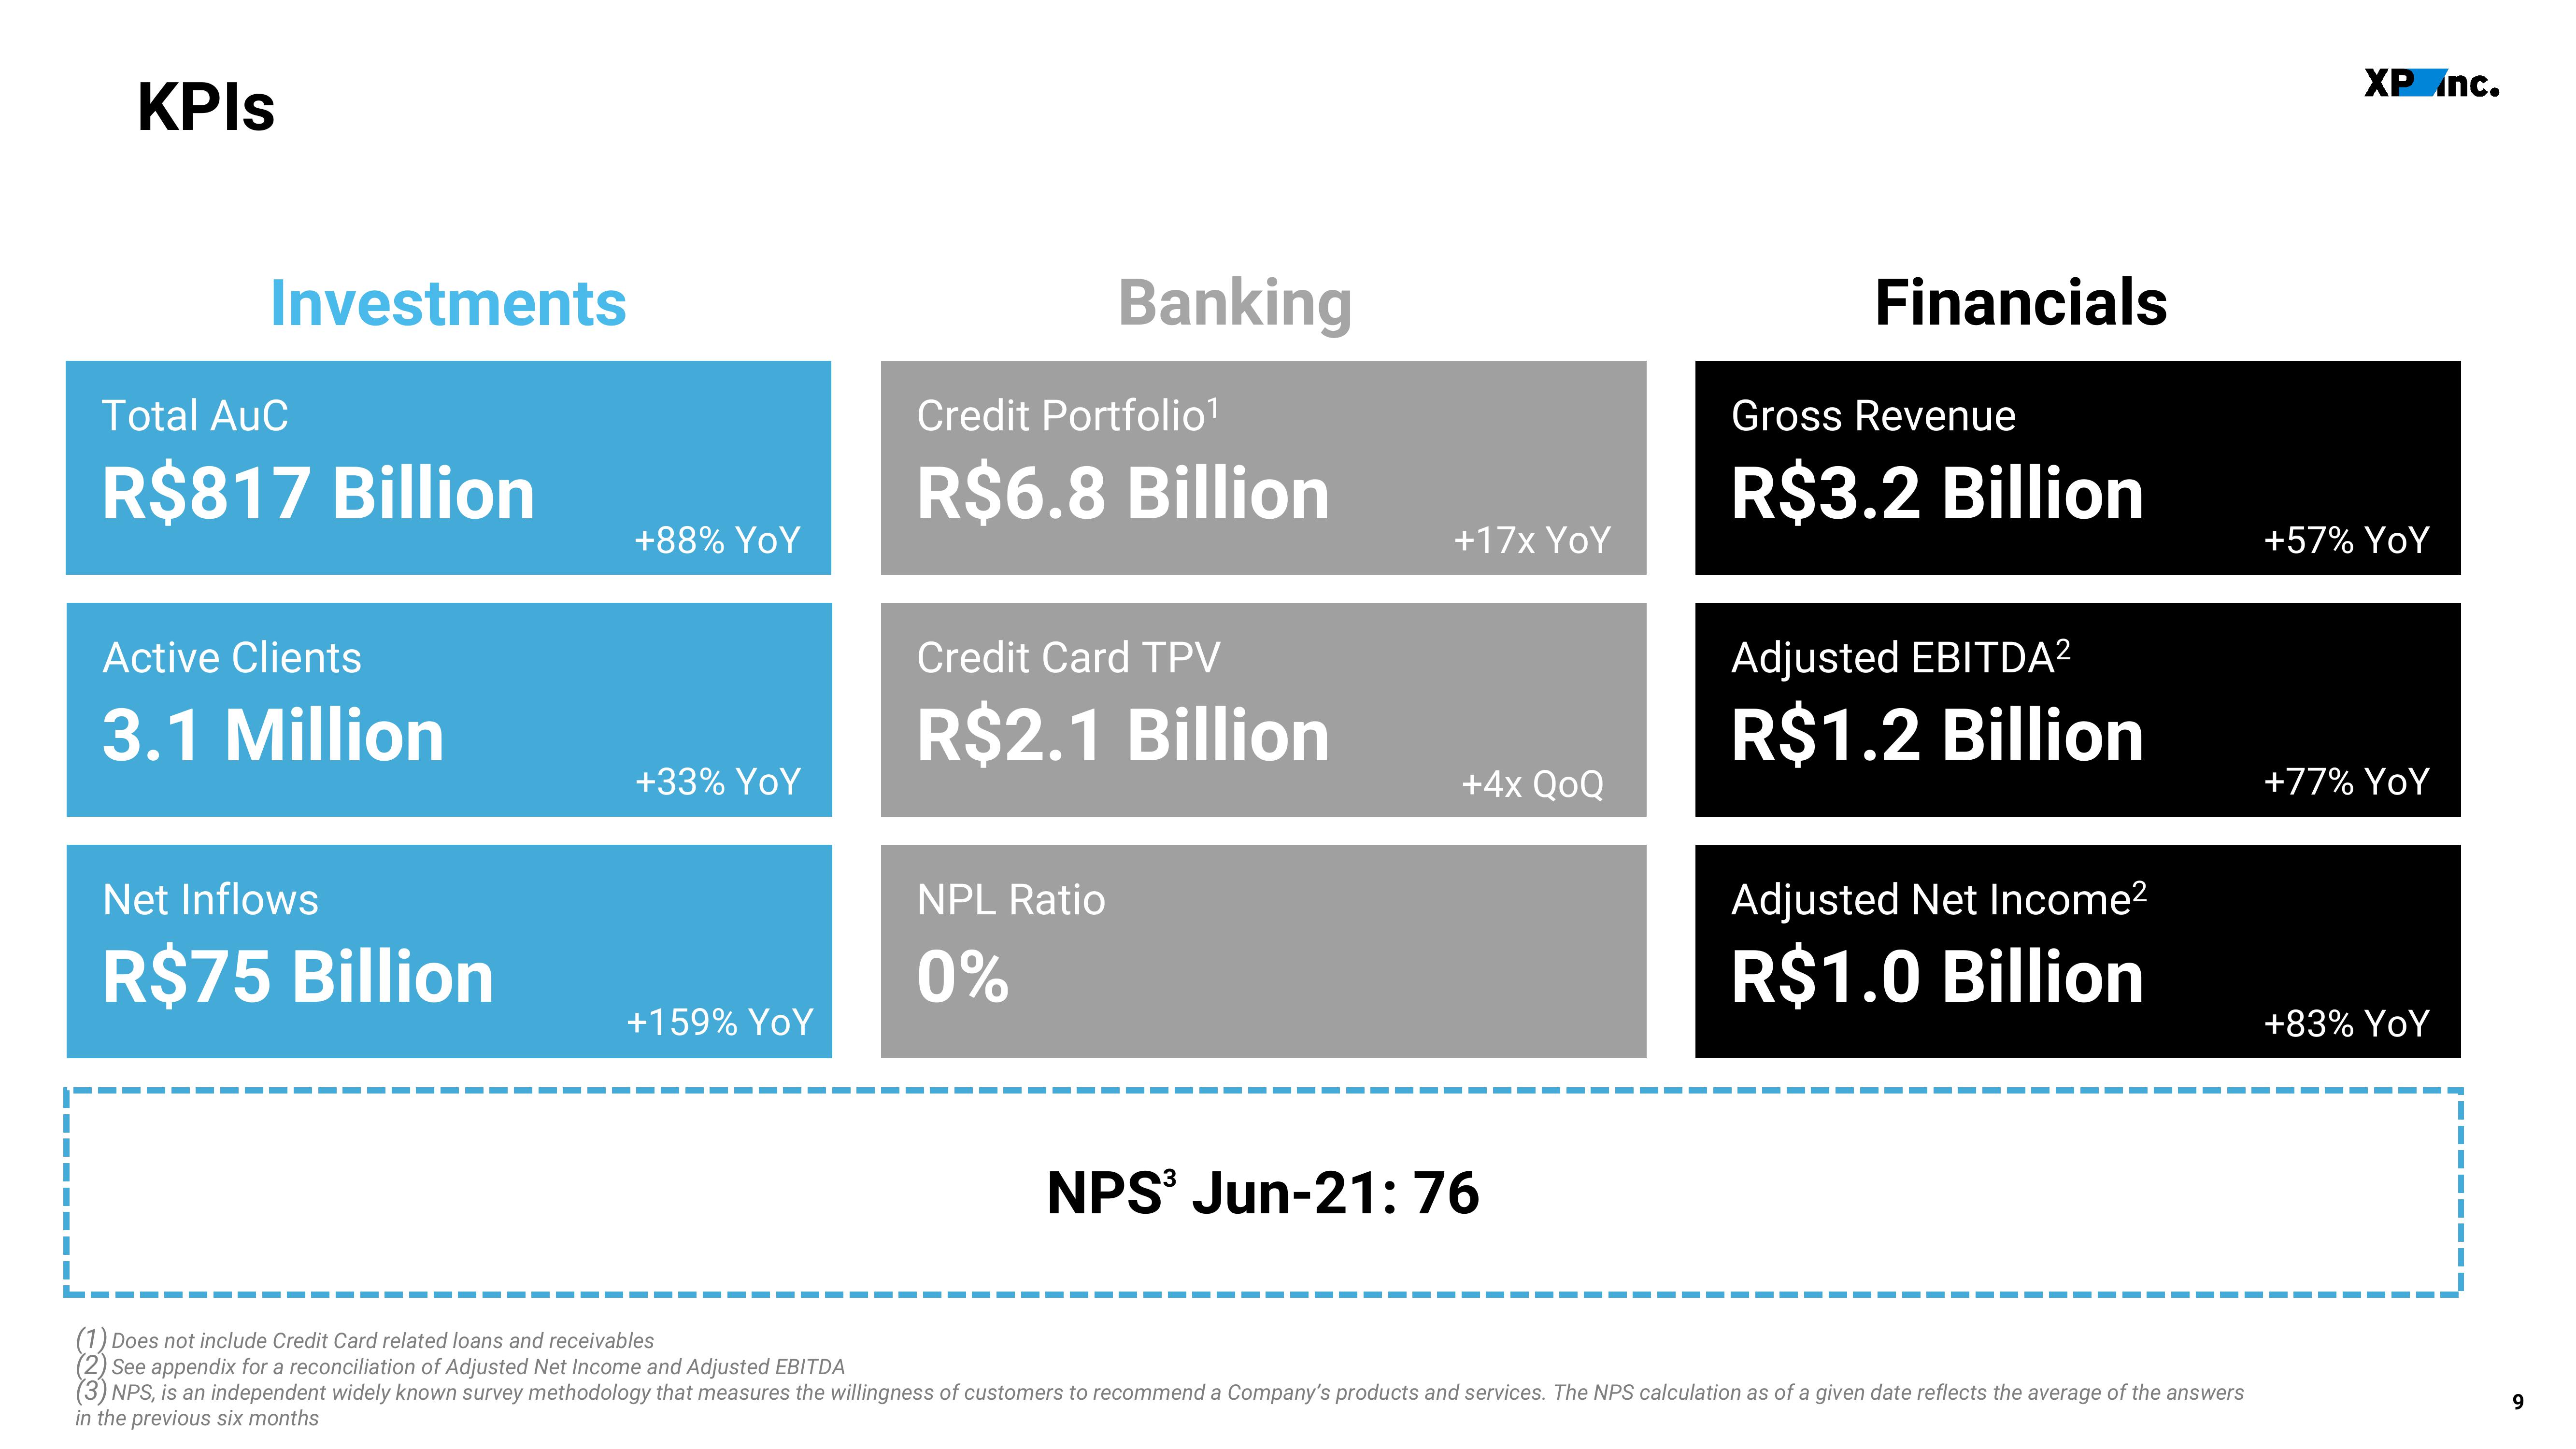
KPIs
Investments
Total AuC
R$817 Billion
Active Clients
3.1 Million
Net Inflows
R$75 Billion
+88% YoY
+33% YoY
+159% YoY
Banking
Credit Portfolio¹
R$6.8 Billion
Credit Card TPV
R$2.1 Billion
NPL Ratio
0%
+17x YoY
+4x QoQ
NPS³ Jun-21: 76
Financials
Gross Revenue
R$3.2 Billion
Adjusted EBITDA²
R$1.2 Billion
Adjusted Net Income²
R$1.0 Billion
(1) Does not include Credit Card related loans and receivables
(2) See appendix for a reconciliation of Adjusted Net Income and Adjusted EBITDA
(3) NPS, is an independent widely known survey methodology that measures the willingness of customers to recommend a Company's products and services. The NPS calculation as of a given date reflects the average of the answers
in the previous six months
XP Inc.
+57% YoY
+77% YoY
+83% YoY
9View entire presentation