Helbiz SPAC Presentation Deck
Operational unit economics breakdown
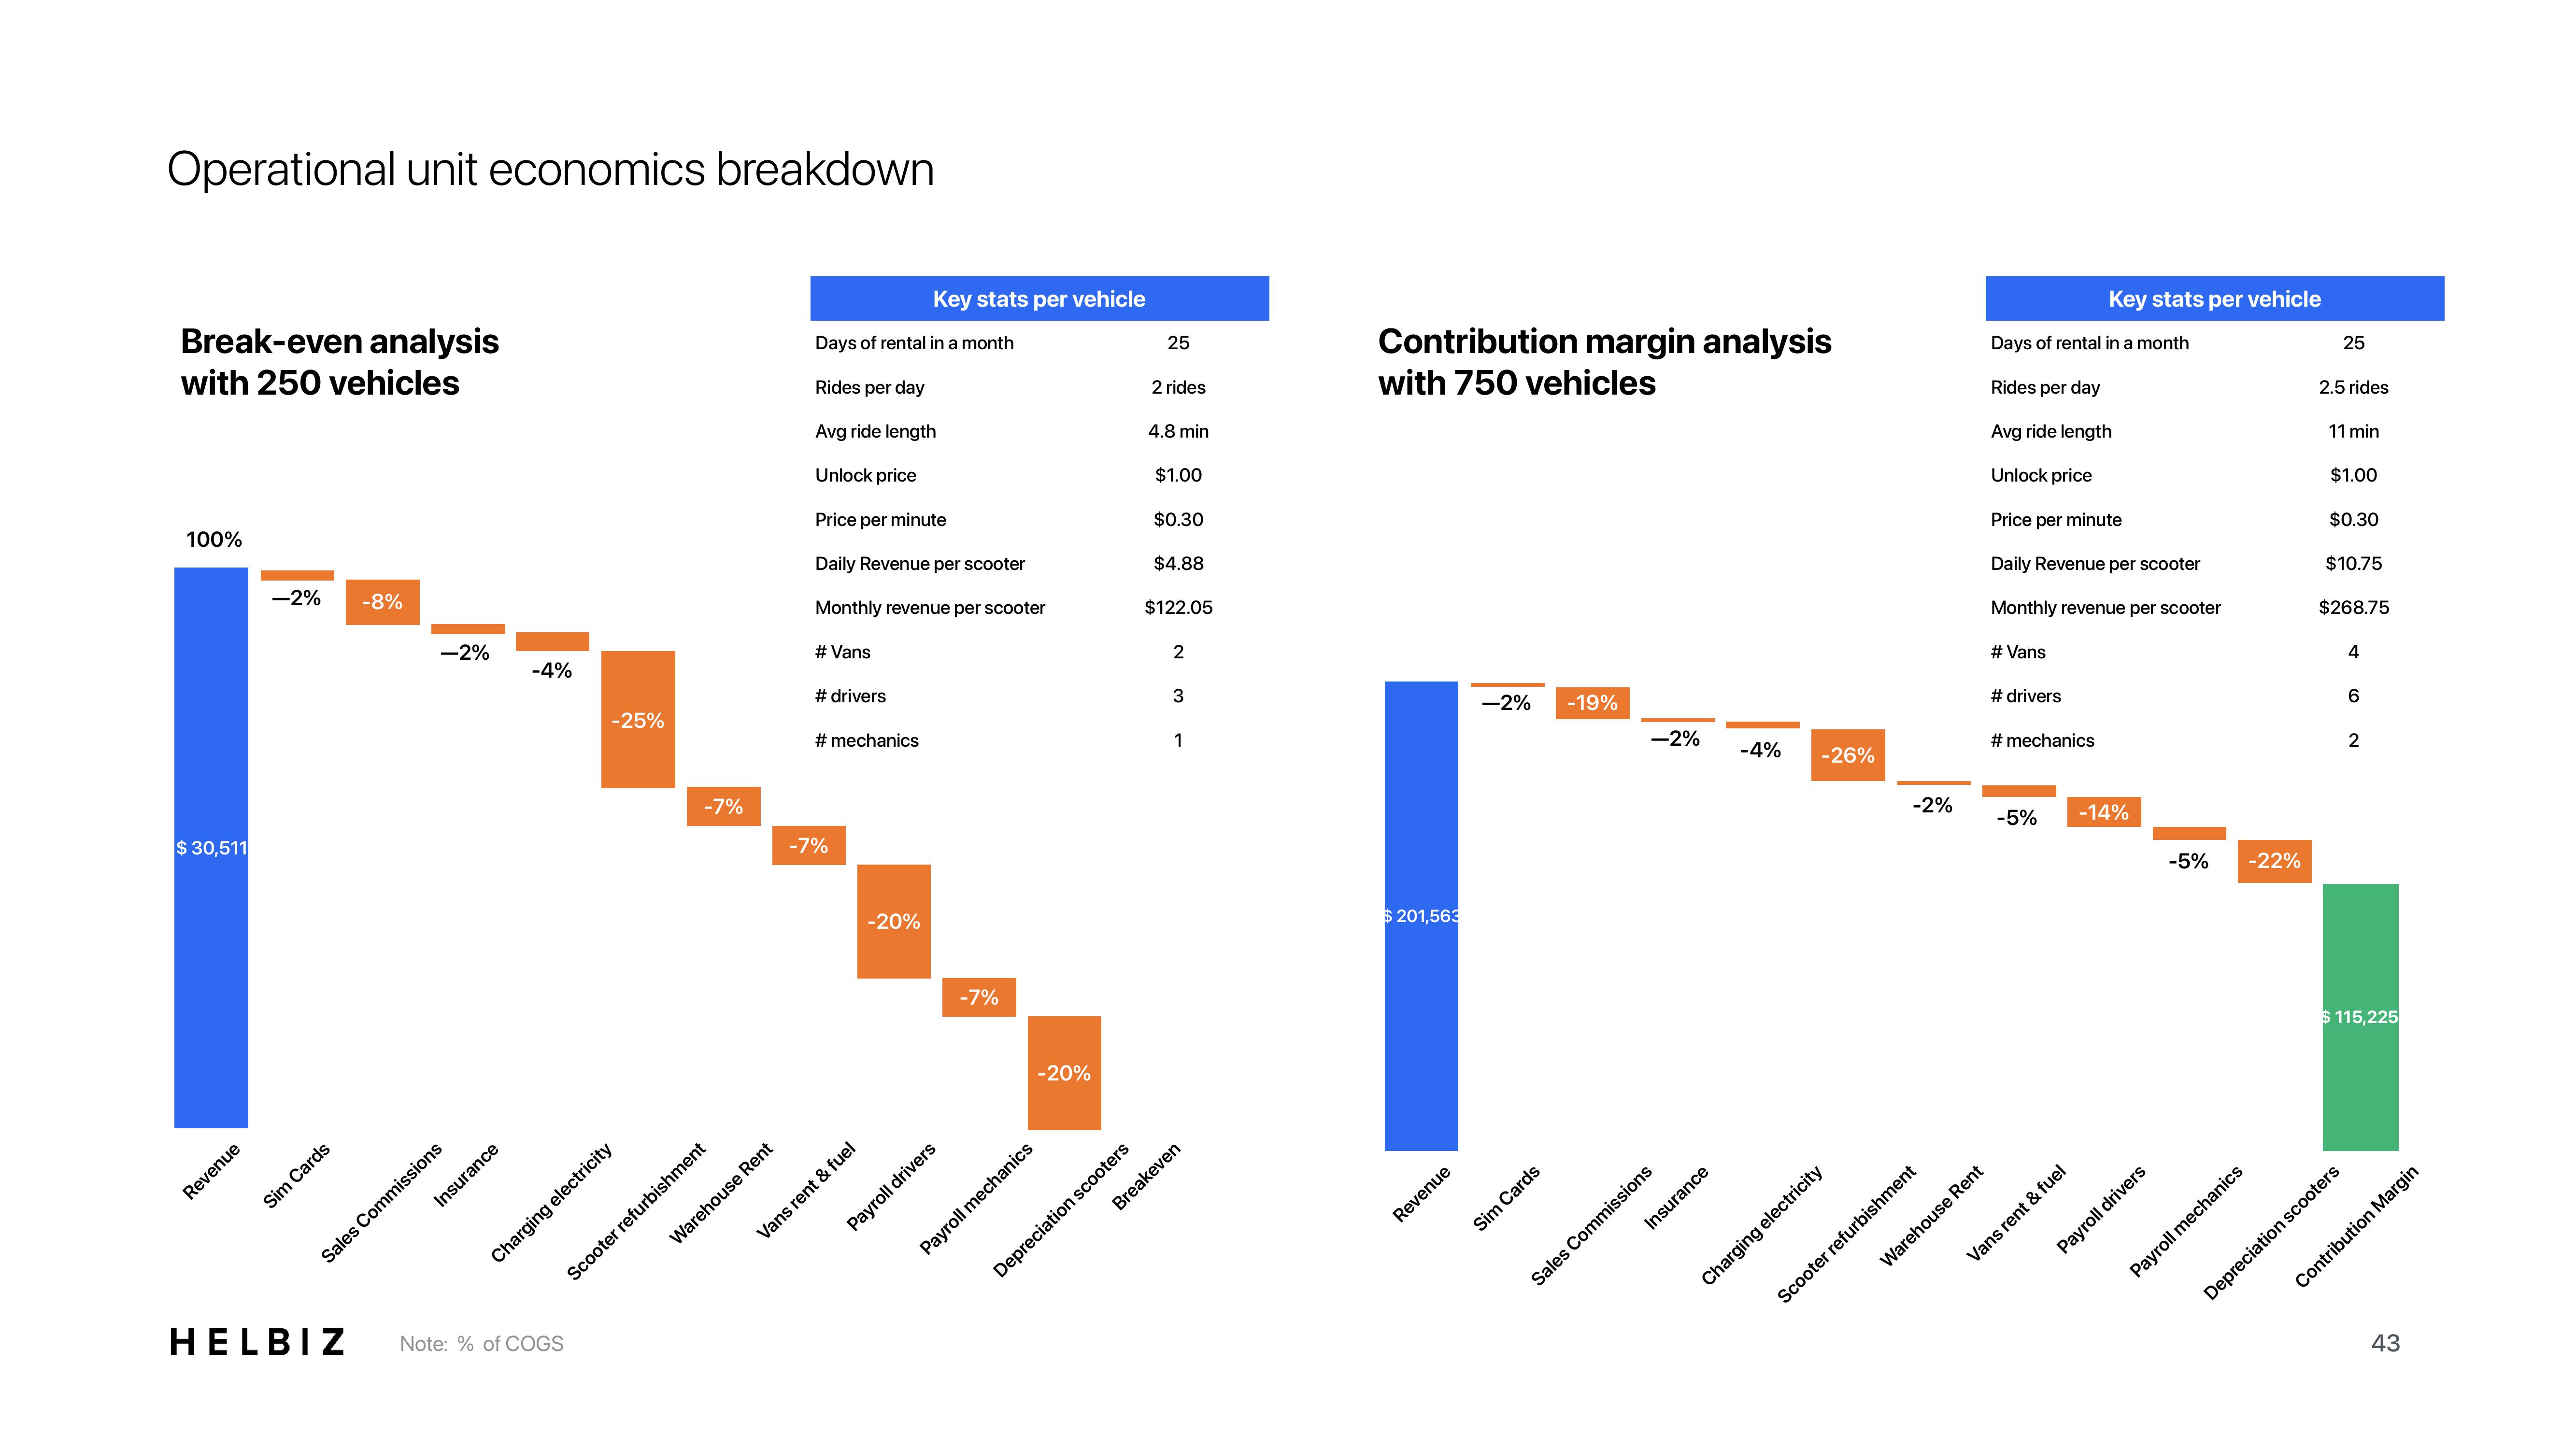
Break-even analysis
with 250 vehicles
100%
$ 30,511
Revenue
-2% -8%
Sim Cards
-2%
Insurance
Sales Commissions
-4%
-25%
Charging electricity
HELBIZ Note: % of COGS
-7%
Scooter refurbishment
Warehouse Rent
Days of rental in a month.
Rides per day
Avg ride length
Unlock price
Price per minute
Daily Revenue per scooter
Monthly revenue per scooter
# Vans
# drivers
# mechanics
-7%
Vans rent & fuel
Key stats per vehicle
-20%
-7%
Payroll drivers
-20%
Payroll mechanics
25
2 rides
4.8 min
$1.00
$0.30
$4.88
$122.05
2
3
1
Breakeven
Depreciation scooters
Contribution margin analysis
with 750 vehicles
$ 201,563
Revenue
-2%
Sim Cards
-19%
-2%
Insurance
Sales Commissions
-4%
-26%
Charging electricity
-2%
Scooter refurbishment
Days of rental in a month
Rides per day
Avg ride length
Unlock price
Price per minute
Daily Revenue per scooter
Monthly revenue per scooter
# Vans
# drivers
# mechanics
Warehouse Rent
Key stats per vehicle
-5% -14%
Vans rent & fuel
-5%
Payroll drivers
-22%
Payroll mechanics
25
2.5 rides
11 min
$1.00
$0.30
$10.75
$268.75
4
6
2
$115,225
Contribution Margin
Depreciation scooters
43View entire presentation