Dutch Bros Results Presentation Deck
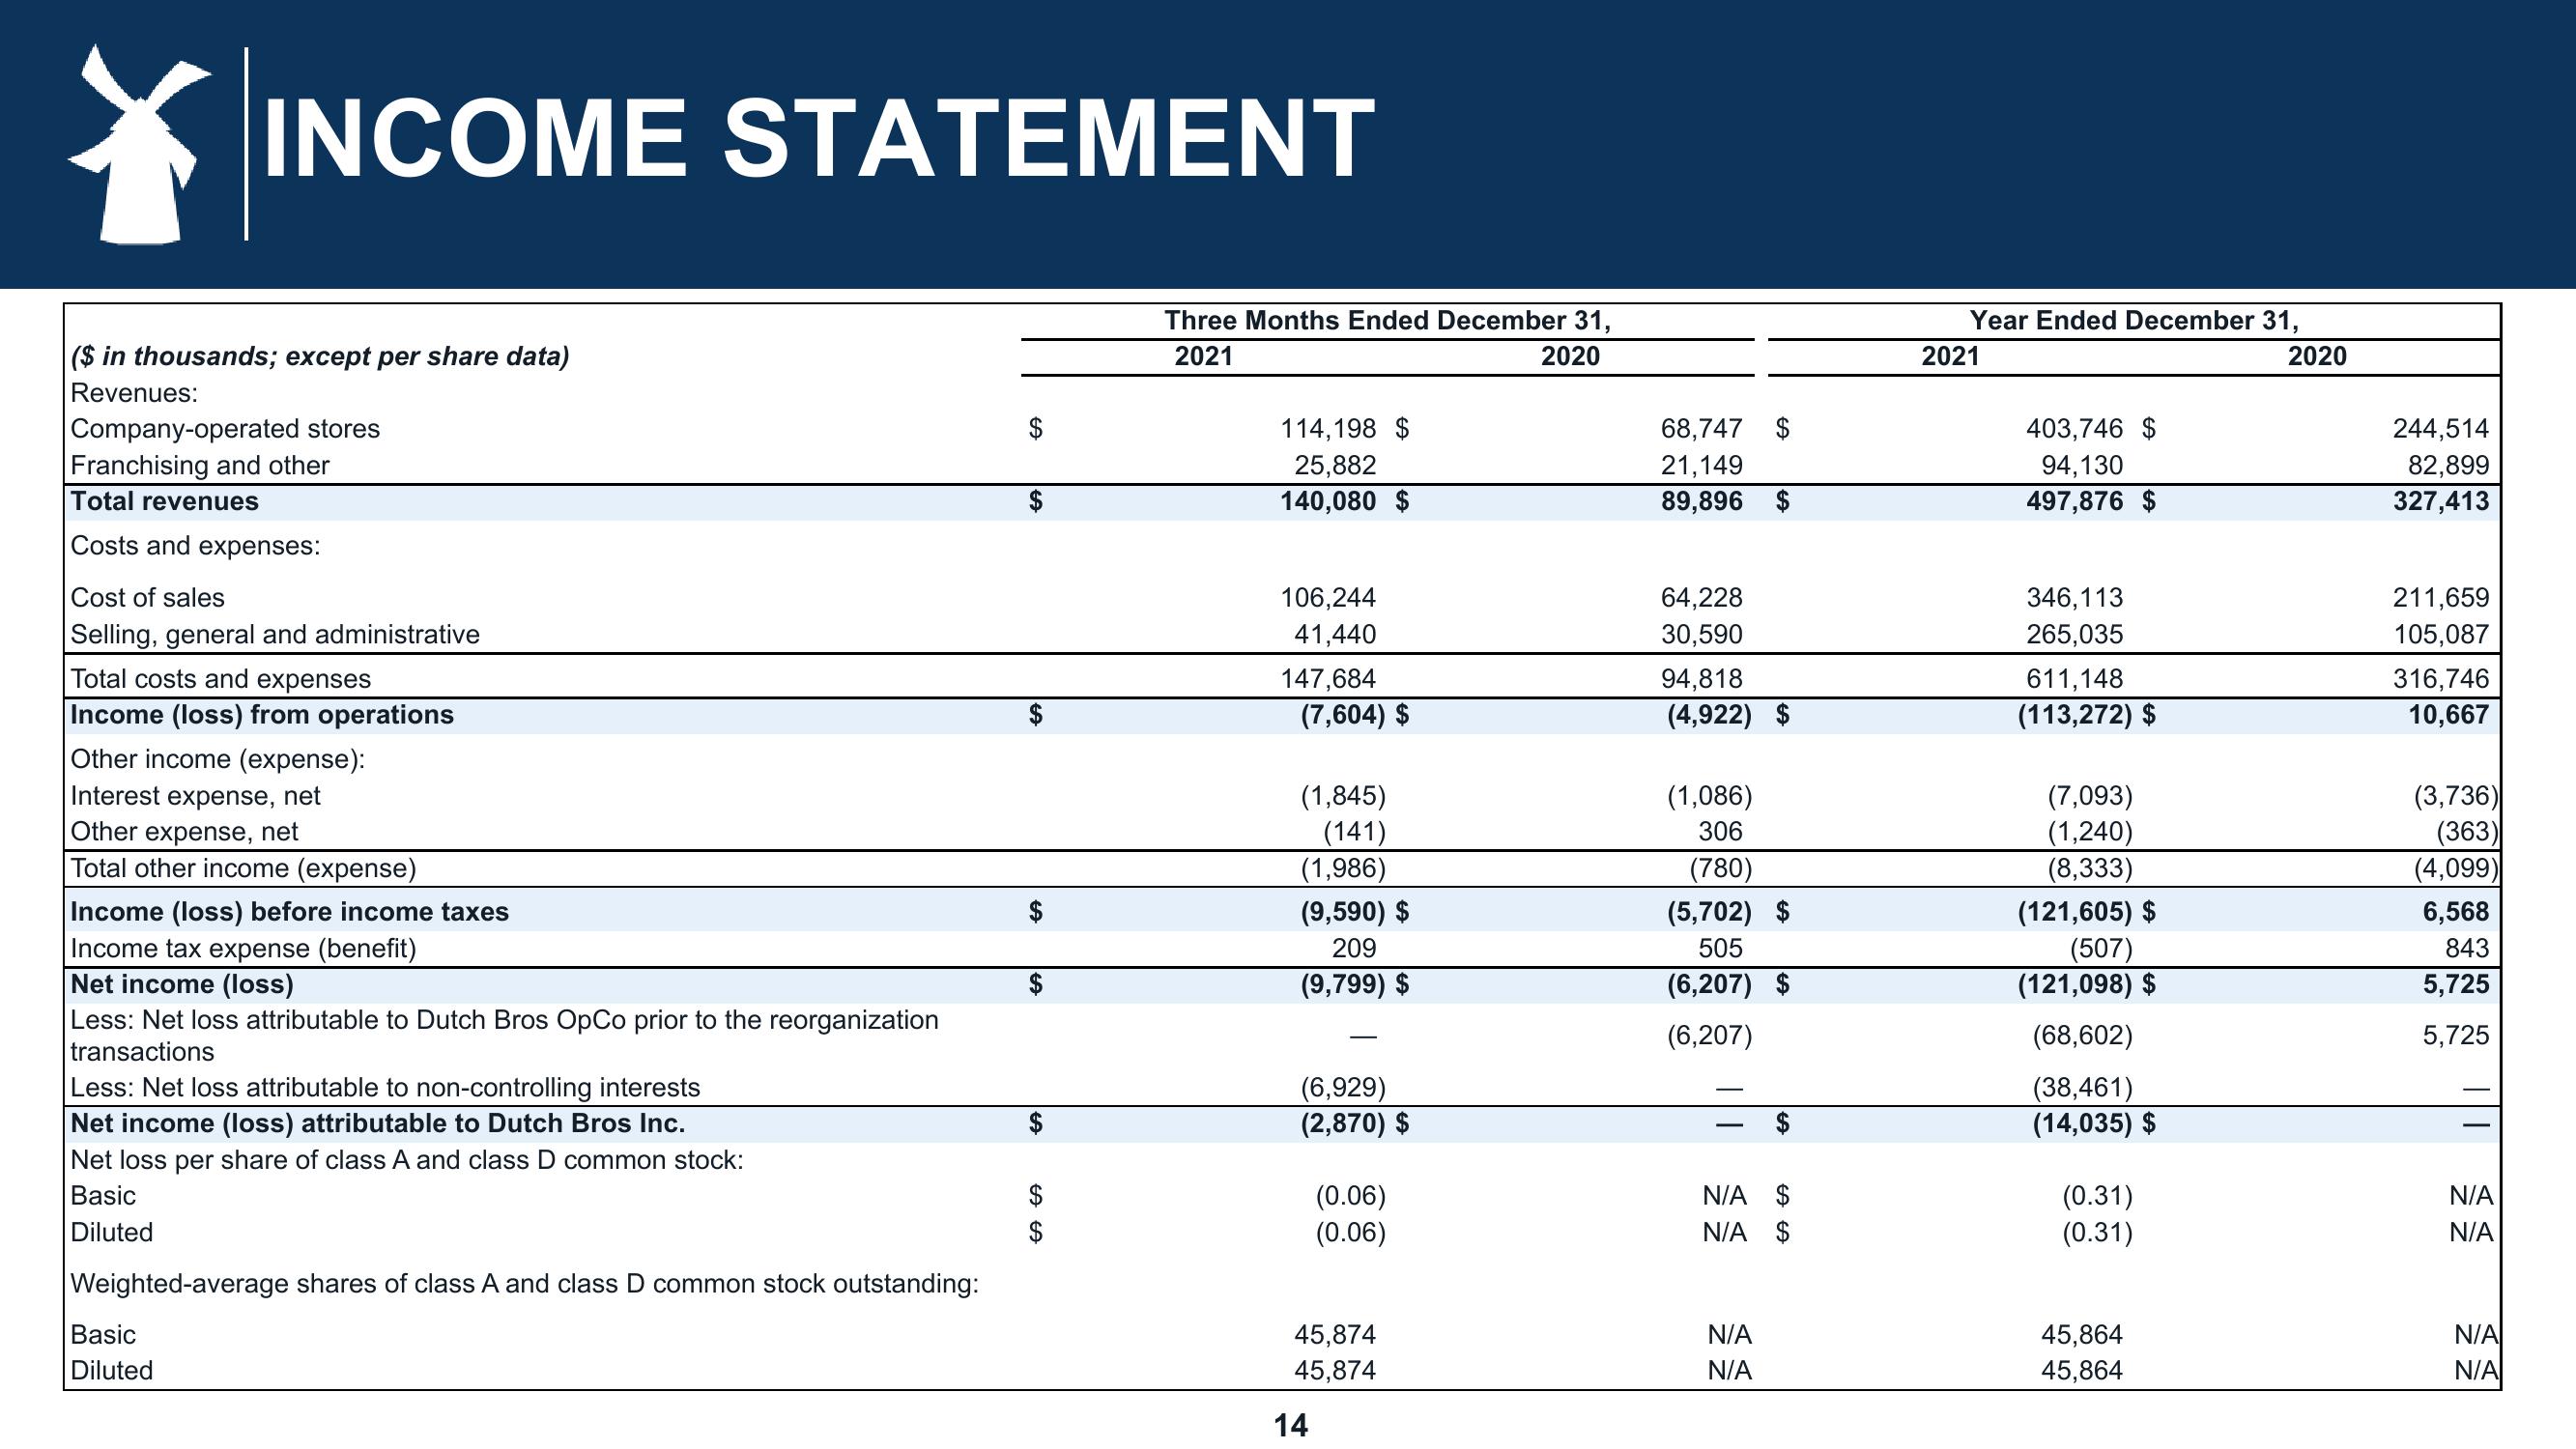
INCOME STATEMENT
($ in thousands; except per share data)
Revenues:
Company-operated stores
Franchising and other
Total revenues
Costs and expenses:
Cost of sales
Selling, general and administrative
Total costs and expenses
Income (loss) from operations
Other income (expense):
Interest expense, net
Other expense, net
Total other income (expense)
Income (loss) before income taxes
Income tax expense (benefit)
Net income (loss)
Less: Net loss attributable to Dutch Bros OpCo prior to the reorganization
transactions
Less: Net loss attributable to non-controlling interests
Net income (loss) attributable to Dutch Bros Inc.
Net loss per share of class A and class D common stock:
Basic
Diluted
Weighted-average shares of class A and class D common stock outstanding:
Basic
Diluted
$
SA
LA
GA GA
Three Months Ended December 31,
2021
2020
114,198 $
25,882
140,080 $
106,244
41,440
147,684
(7,604) $
(1,845)
(141)
(1,986)
(9,590) $
209
(9,799) $
(6,929)
(2,870) $
(0.06)
(0.06)
45,874
45,874
14
68,747 $
21,149
89,896 $
64,228
30,590
94,818
(4,922) $
(1,086)
306
(780)
(5,702) $
505
(6,207) $
(6,207)
SA
N/A $
N/A $
N/A
N/A
Year Ended December 31,
2021
403,746 $
94,130
497,876 $
346,113
265,035
611,148
(113,272) $
(7,093)
(1,240)
(8,333)
(121,605) $
(507)
(121,098) $
(68,602)
(38,461)
(14,035) $
(0.31)
(0.31)
45,864
45,864
2020
244,514
82,899
327,413
211,659
105,087
316,746
10,667
(3,736)
(363)
(4,099)
6,568
843
5,725
5,725
N/A
N/A
N/A
N/AView entire presentation