J.P.Morgan 2Q23 Investor Results
JPMORGAN CHASE & CO.
CONSOLIDATED BALANCE SHEETS
(in millions)
ASSETS
Cash and due from banks
Deposits with banks
Federal funds sold and securities purchased under
resale agreements
Securities borrowed
Trading assets:
Debt and equity instruments
Derivative receivables
Available-for-sale ("AFS") securities
Held-to-maturity ("HTM") securities
Investment securities, net of allowance for credit losses
Loans
Less: Allowance for loan losses
Loans, net of allowance for loan losses
Accrued interest and accounts receivable
Premises and equipment
Goodwill, MSRs and other intangible assets
Other assets
TOTAL ASSETS
LIABILITIES
Deposits
Federal funds purchased and securities loaned or sold
under repurchase agreements
Short-term borrowings
Trading liabilities:
Debt and equity instruments
Derivative payables
Accounts payable and other liabilities
Beneficial interests issued by consolidated VIES
Long-term debt
TOTAL LIABILITIES
STOCKHOLDERS' EQUITY
Preferred stock
Common stock
Additional paid-in capital
Retained earnings
Accumulated other comprehensive income/(loss) ("AOCI")
Treasury stock, at cost
TOTAL STOCKHOLDERS' EQUITY
TOTAL LIABILITIES AND STOCKHOLDERS' EQUITY
$
Jun 30,
2023
26,064
469,059
325,628
163,563
572,779
64,217
203,262 (a)
408,941
612,203
1,300,069 (a)
21,980 (b)
1,278,089
111,561
29,493
64,238
151,346
$ 3,868,240
266,272
41,022
132,264
46,545
286,934
19,647
364,078 (c)
3,555,724
$
27,404
4,105
89,578
317,359
(14,290)
(111,640)
312,516
$ 3,868,240
Mar 31,
2023
$ 2,398,962 (a) $ 2,377,253
25,098
520,902
317,111
195,917
519,618
59,274
197,248
412,827
610,075
1,128,896
20,053
1,108,843
115,316
28,266
62,090
181,795
$ 3,744,305
246,396
42,241
145,153
44,711
275,077
14,903
295,489
3,441,223
27,404
4,105
89,155
306,208
(14,418)
(109,372)
303,082
$ 3,744,305
$
Dec 31,
2022
27,697
539,537
315,592
185,369
382,919
70,880
205,857
425,305
631,162
1,135,647
19,726
1,115,921
125,189
27,734
60,859
182,884
$ 3,665,743
$ 2,340,179
202,613
44,027
126,835
51,141
300,141
12,610
295,865
3,373,411
27,404
4,105
89,044
296,456
(17,341)
(107,336)
292,332
$ 3,665,743
JPMORGAN CHASE & CO.
Jun 30, 2023
Change
$
Sep 30,
2022
24,654
619,533
301,878
193,216
413,953
92,534
188,140
430,106
618,246
1,112,633
18,185
1,094,448
143,905
27,199
60,806
183,512
$ 3,773,884
$ 2,408,615
239,939
47,866
133,175
56,703
300,016
12,079
287,473
3,485,866
32,838
4,105
88,865
288,776
(19,134)
(107,432)
288,018
$ 3,773,884
$
Jun 30,
2022
27,215
642,045
322,156
202,393
384,260
81,317
222,069
441,649
663,718
1,104,155
17,750
1,086,405
145,442
26,770
59,360
200,233
$ 3,841,314
$ 2,471,544
222,719
58,422
137,891
52,417
313,326
10,640
288,212
3,555,171
32,838
4,105
88,614
282,445
(14,369)
(107,490)
286,143
$ 3,841,314
Mar 31,
2023
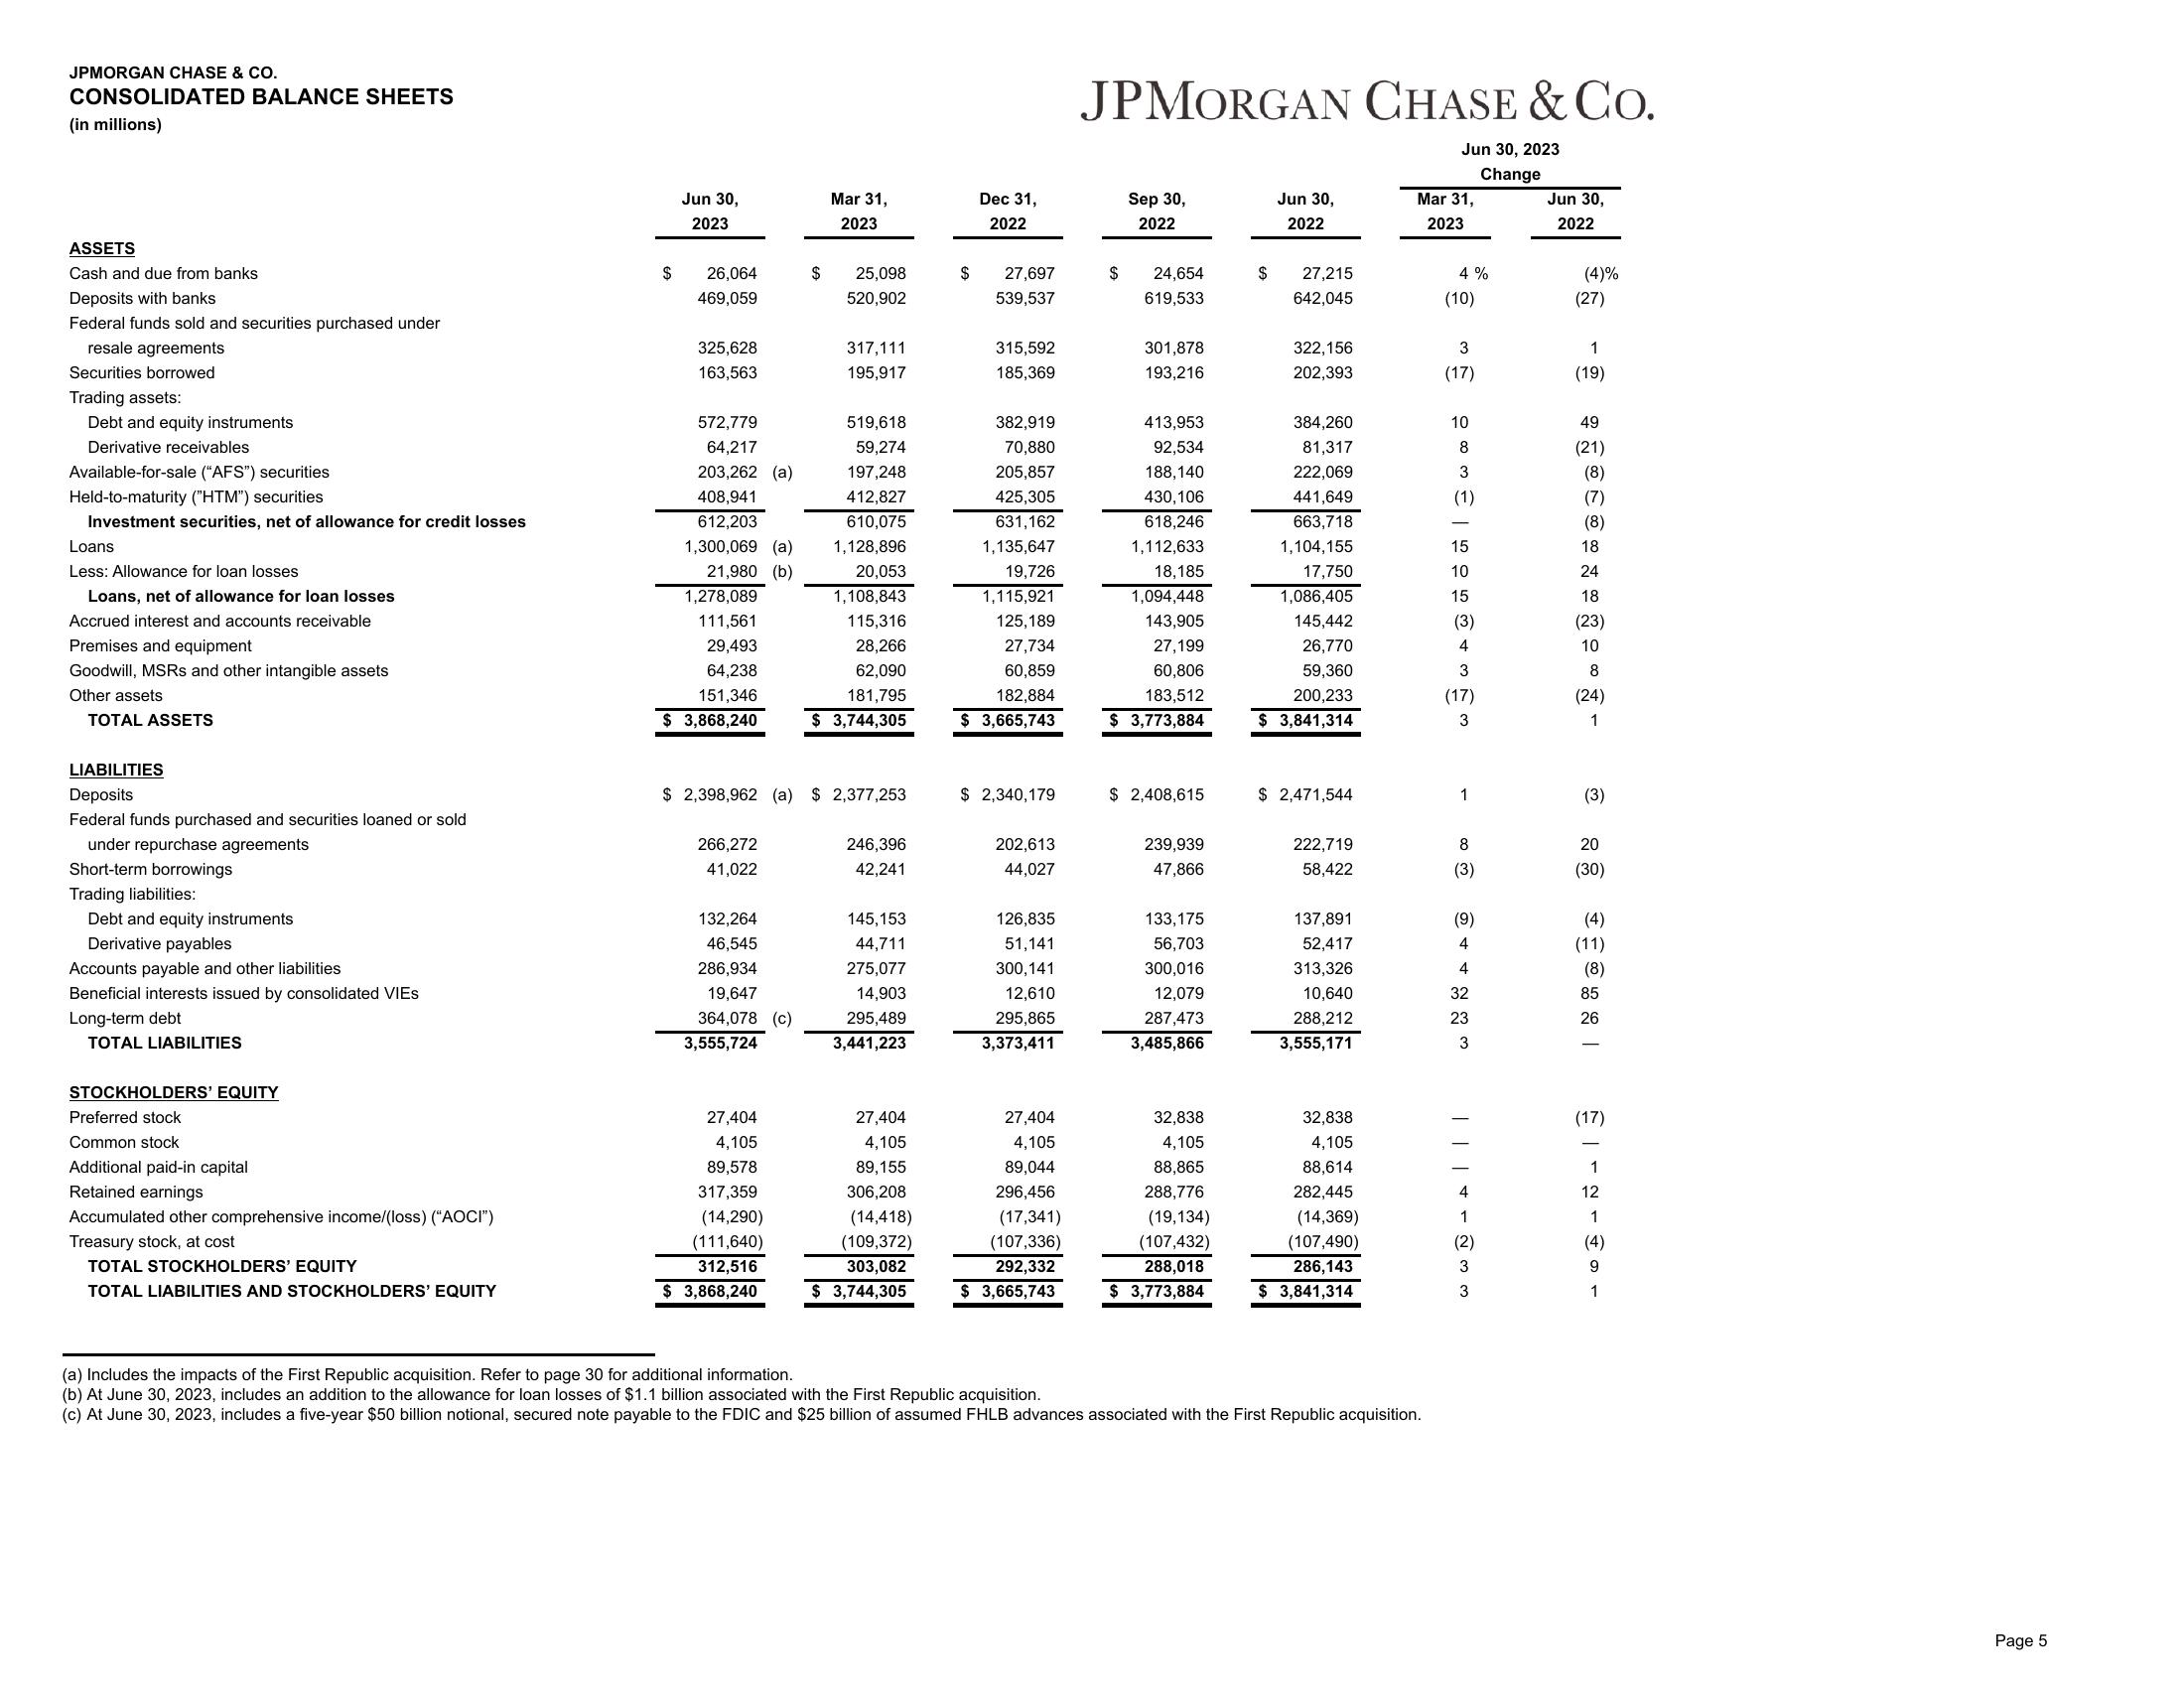
(a) Includes the impacts of the First Republic acquisition. Refer to page 30 for additional information.
(b) At June 30, 2023, includes an addition to the allowance for loan losses of $1.1 billion associated with the First Republic acquisition.
(c) At June 30, 2023, includes a five-year $50 billion notional, secured note payable to the FDIC and $25 billion of assumed FHLB advances associated with the First Republic acquisition.
4%
(10)
3
(17)
W WA @JO
(17)
1
8
(3)
(9)
4
4
32
23
3
w w ÑAT
(2)
Jun 30,
2022
(4)%
(27)
1
(19)
49
(21)
(8)
(7)
(8)
18
24
18
(23)
10
8
(24)
1
(3)
20
(30)
(4)
(11)
(8)
85
26
(17)
1
12
1
(4)
9
1
Page 5View entire presentation