Truist Financial Corp Results Presentation Deck
Net interest income & net interest margin
$3,261
$255
$3,006
2.81%
2.58%
3Q21
$3,267
$237
$3,030
2.76%
2.55%
4Q21
5-Quarter Trend
$3,209
$210
$2,999
1 See non-GAAP reconciliations in the appendix
2.76%
2.57%
1Q22
$3,435
$204
$3,231
2.89%
2.72%
2Q22
Core net interest income TE ($ MM)
Purchase accounting accretion ($ MM)
Reported NIM (%)
1
Core NIM (%)
$3,783
$113
$3,670
3.12%
3.02%
3Q22
-
vs. Prior Quarter
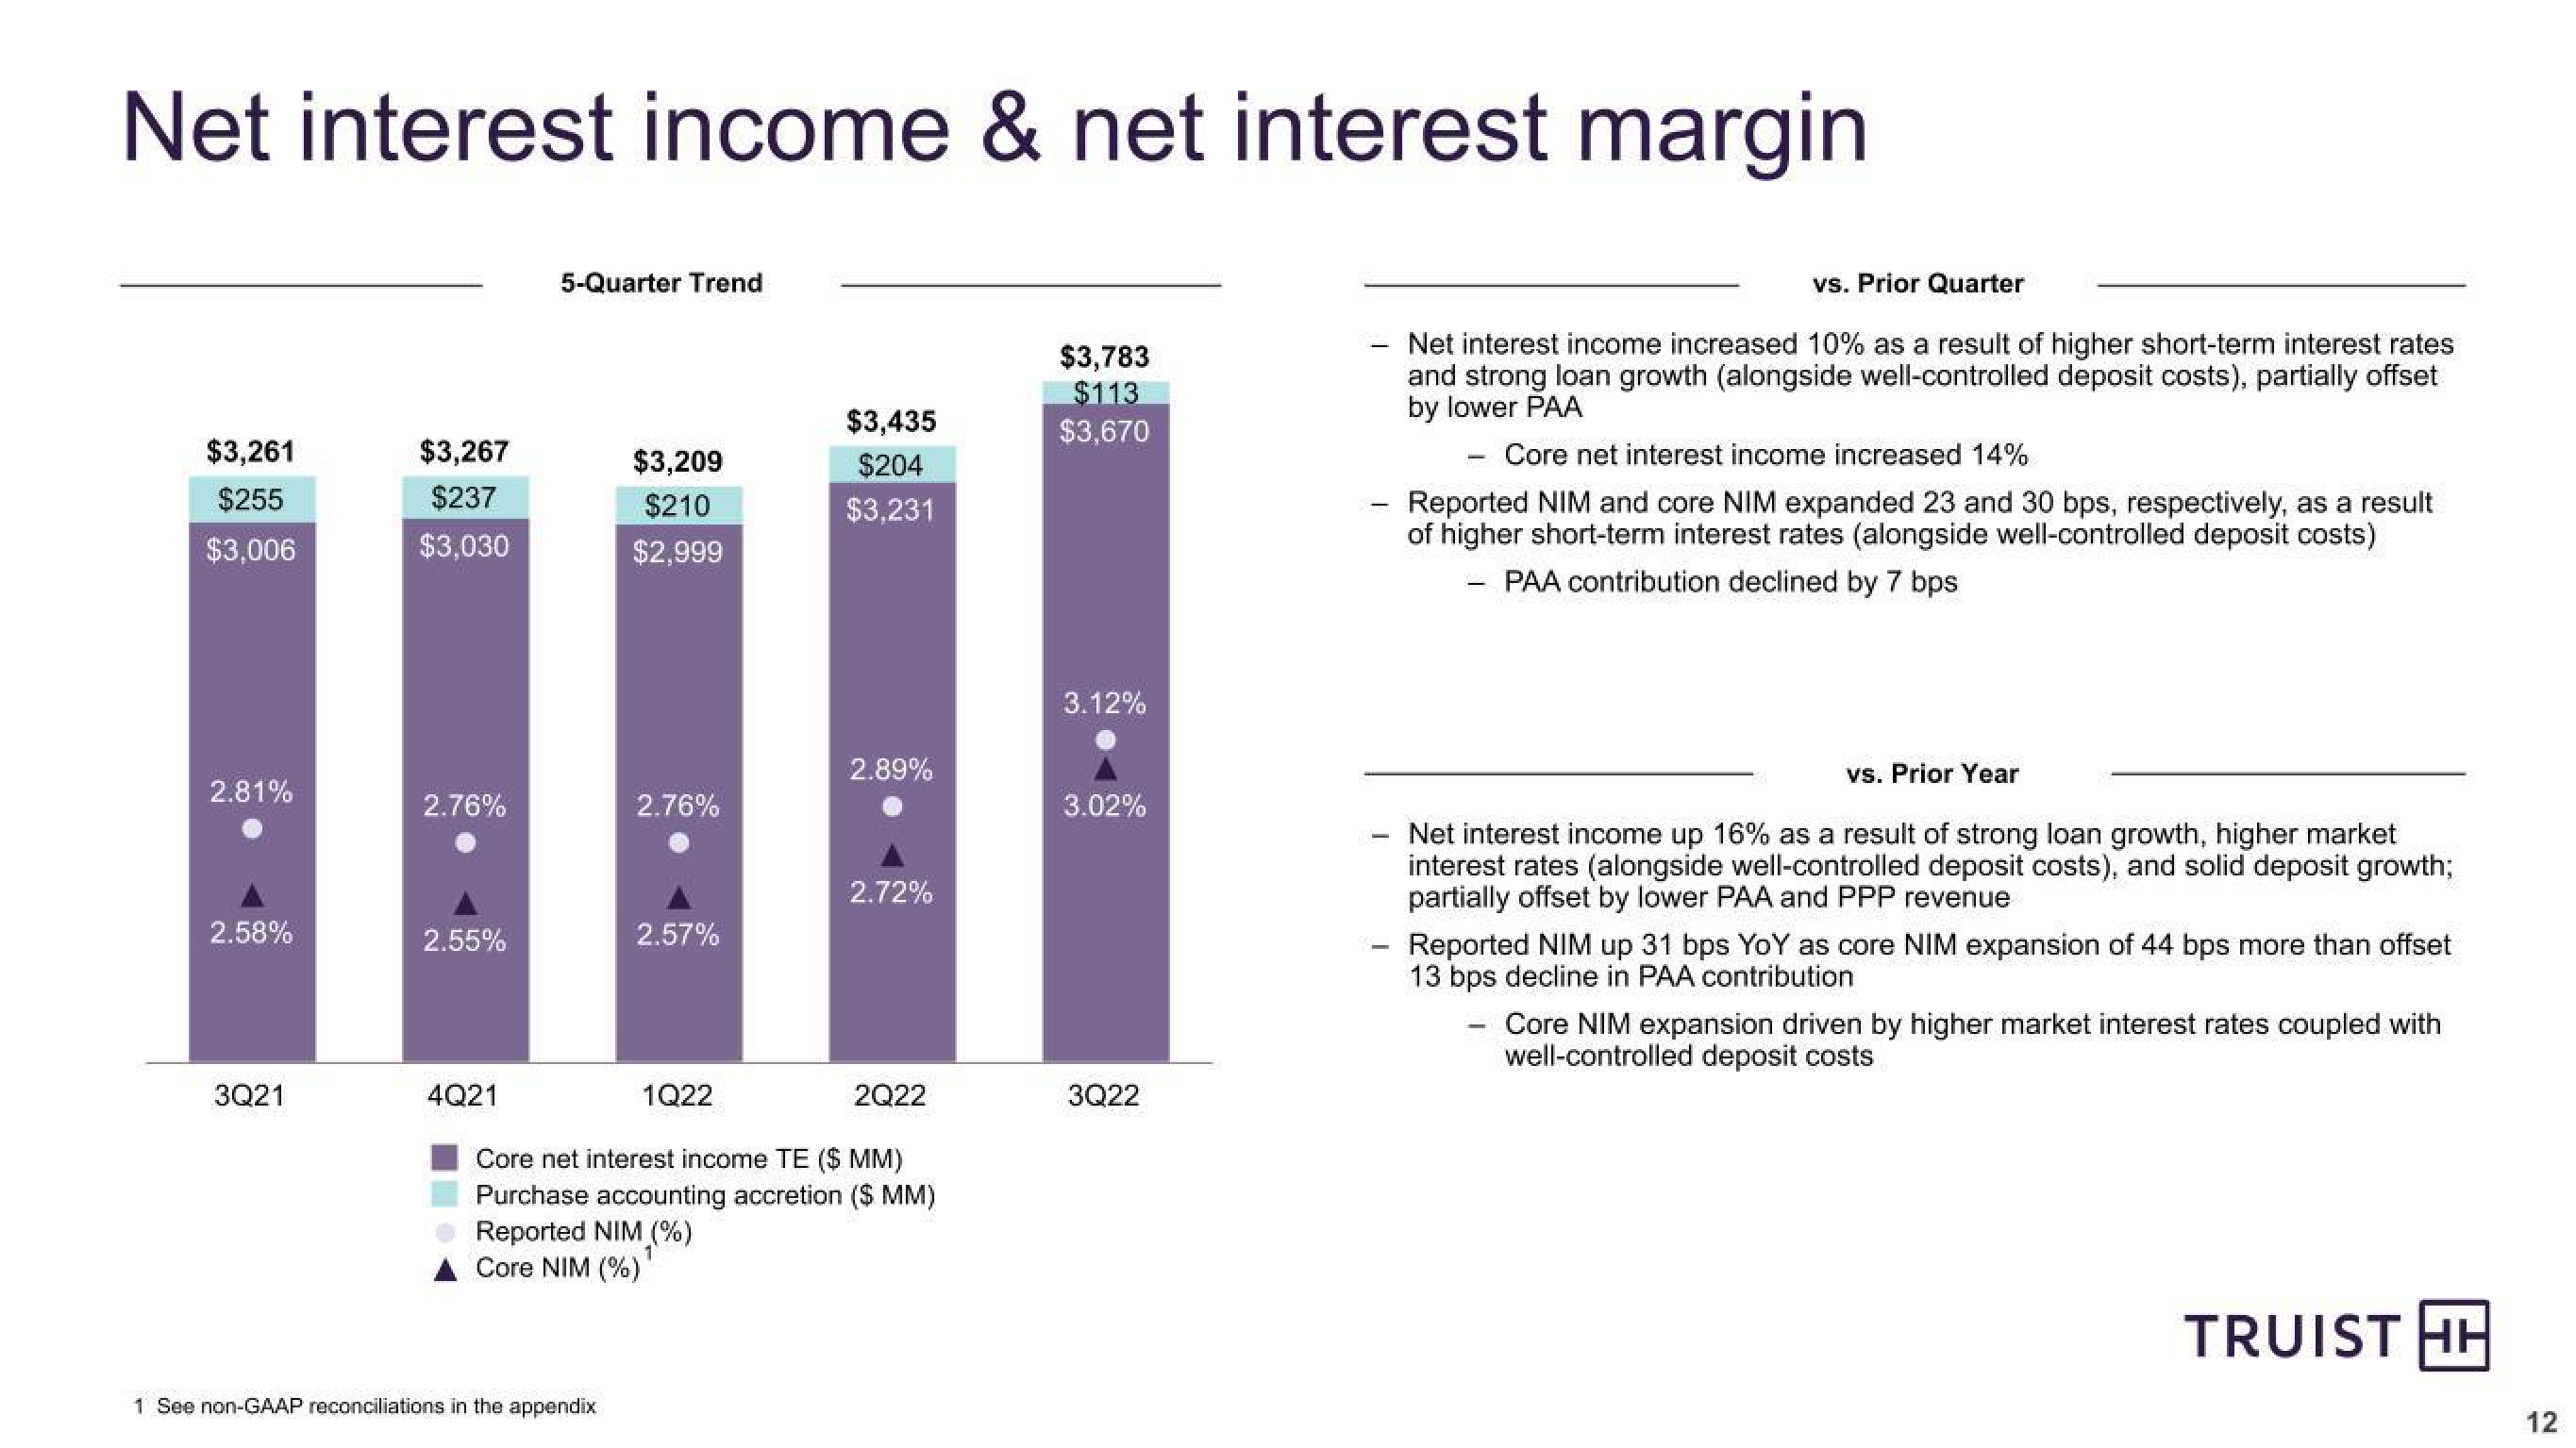
Net interest income increased 10% as a result of higher short-term interest rates
and strong loan growth (alongside well-controlled deposit costs), partially offset
by lower PAA
Core net interest income increased 14%
Reported NIM and core NIM expanded 23 and 30 bps, respectively, as a result
of higher short-term interest rates (alongside well-controlled deposit costs)
PAA contribution declined by 7 bps
-
vs. Prior Year
Net interest income up 16% as a result of strong loan growth, higher market
interest rates (alongside well-controlled deposit costs), and solid deposit growth;
partially offset by lower PAA and PPP revenue
Reported NIM up 31 bps YoY as core NIM expansion of 44 bps more than offset
13 bps decline in PAA contribution
-
Core NIM expansion driven by higher market interest rates coupled with
well-controlled deposit costs
TRUIST HH
12View entire presentation