Weber Results Presentation Deck
GROSS MARGIN IMPACT OF SUPPLY CHAIN DYNAMICS
43.6%
GROSS MARGIN BRIDGE: FY21 Q1 VS. FY22 Q1 VS. FY 22 Q2
Illustrative
Impact
Q1 21 Actuals Pricing
Illustrative
Headwind
Inbound
Freight
Illustrative
Headwind Illustrative
Headwind
Note: Fiscal Year ending September 30.
Price Increase Announce Date
P&L Impact
22.6%
Commodity / Other Q1 22 Actuals Pricing
Purchased
Goods Cost
Sep ¹21
FY'Q1/Q2
Illustrative
Impact
Feb '22
FY'Q3/Q4
Illustrative
Impact
+1,170bps
Sequential
Improvement
60-90 Day Lag in Realization of Implemented Pricing Action Delays Margin Recovery in
Current Inflationary Environment
34.3%
Poland Q2 22 Actuals
Impact and
Other
Run-Rate
FY'Q3/Q4
I
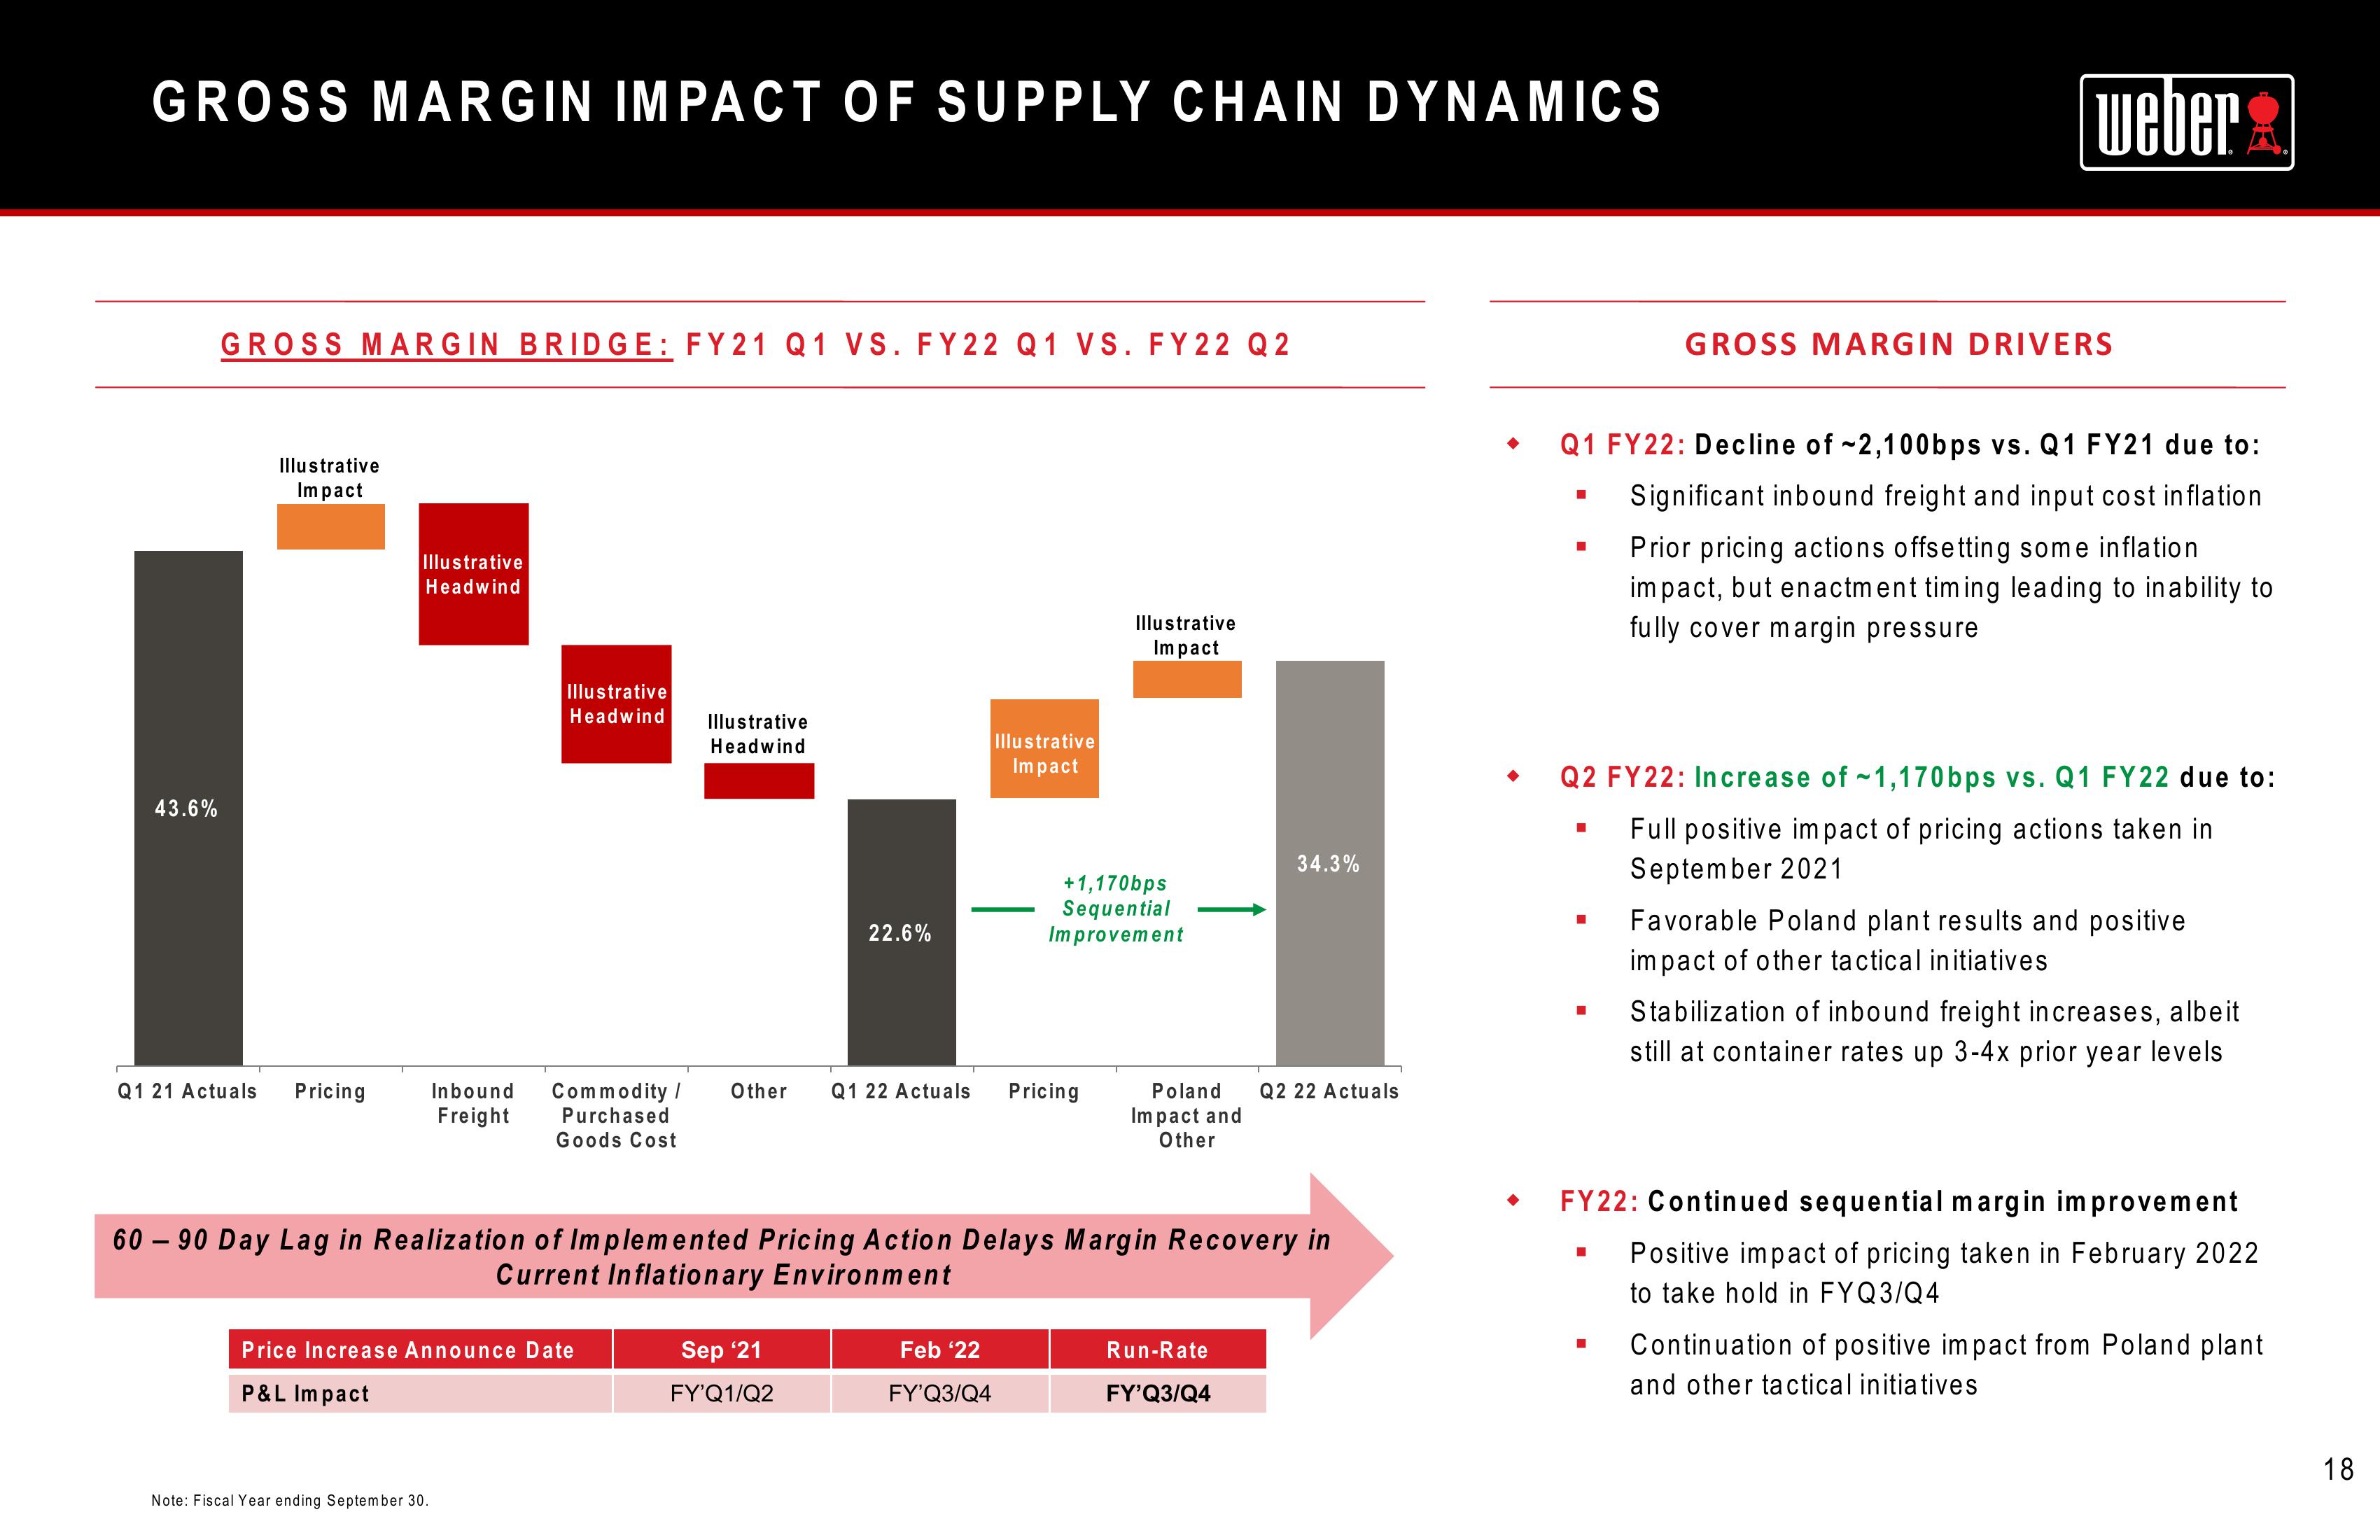
♦ Q1 FY22: Decline of -2,100bps vs. Q1 FY21 due to:
Significant inbound freight and input cost inflation
Prior pricing actions offsetting some inflation
impact, but enactment timing leading to inability to
fully cover margin pressure
■
I
weber
Q2 FY22: Increase of -1,170bps vs. Q1 FY22 due to:
Full positive impact of pricing actions taken in
September 2021
I
GROSS MARGIN DRIVERS
■
Favorable Poland plant results and positive
impact of other tactical initiatives
■ Stabilization of inbound freight increases, albeit
still at container rates up 3-4x prior year levels
FY22: Continued sequential margin improvement
Positive impact of pricing taken in February 2022
to take hold in FYQ3/Q4
Continuation of positive impact from Poland plant
and other tactical initiatives
18View entire presentation