Toast Results Presentation Deck
© 2022 Toast, Inc. All Rights Reserved.
10
This Is Just The Beginning For Toast
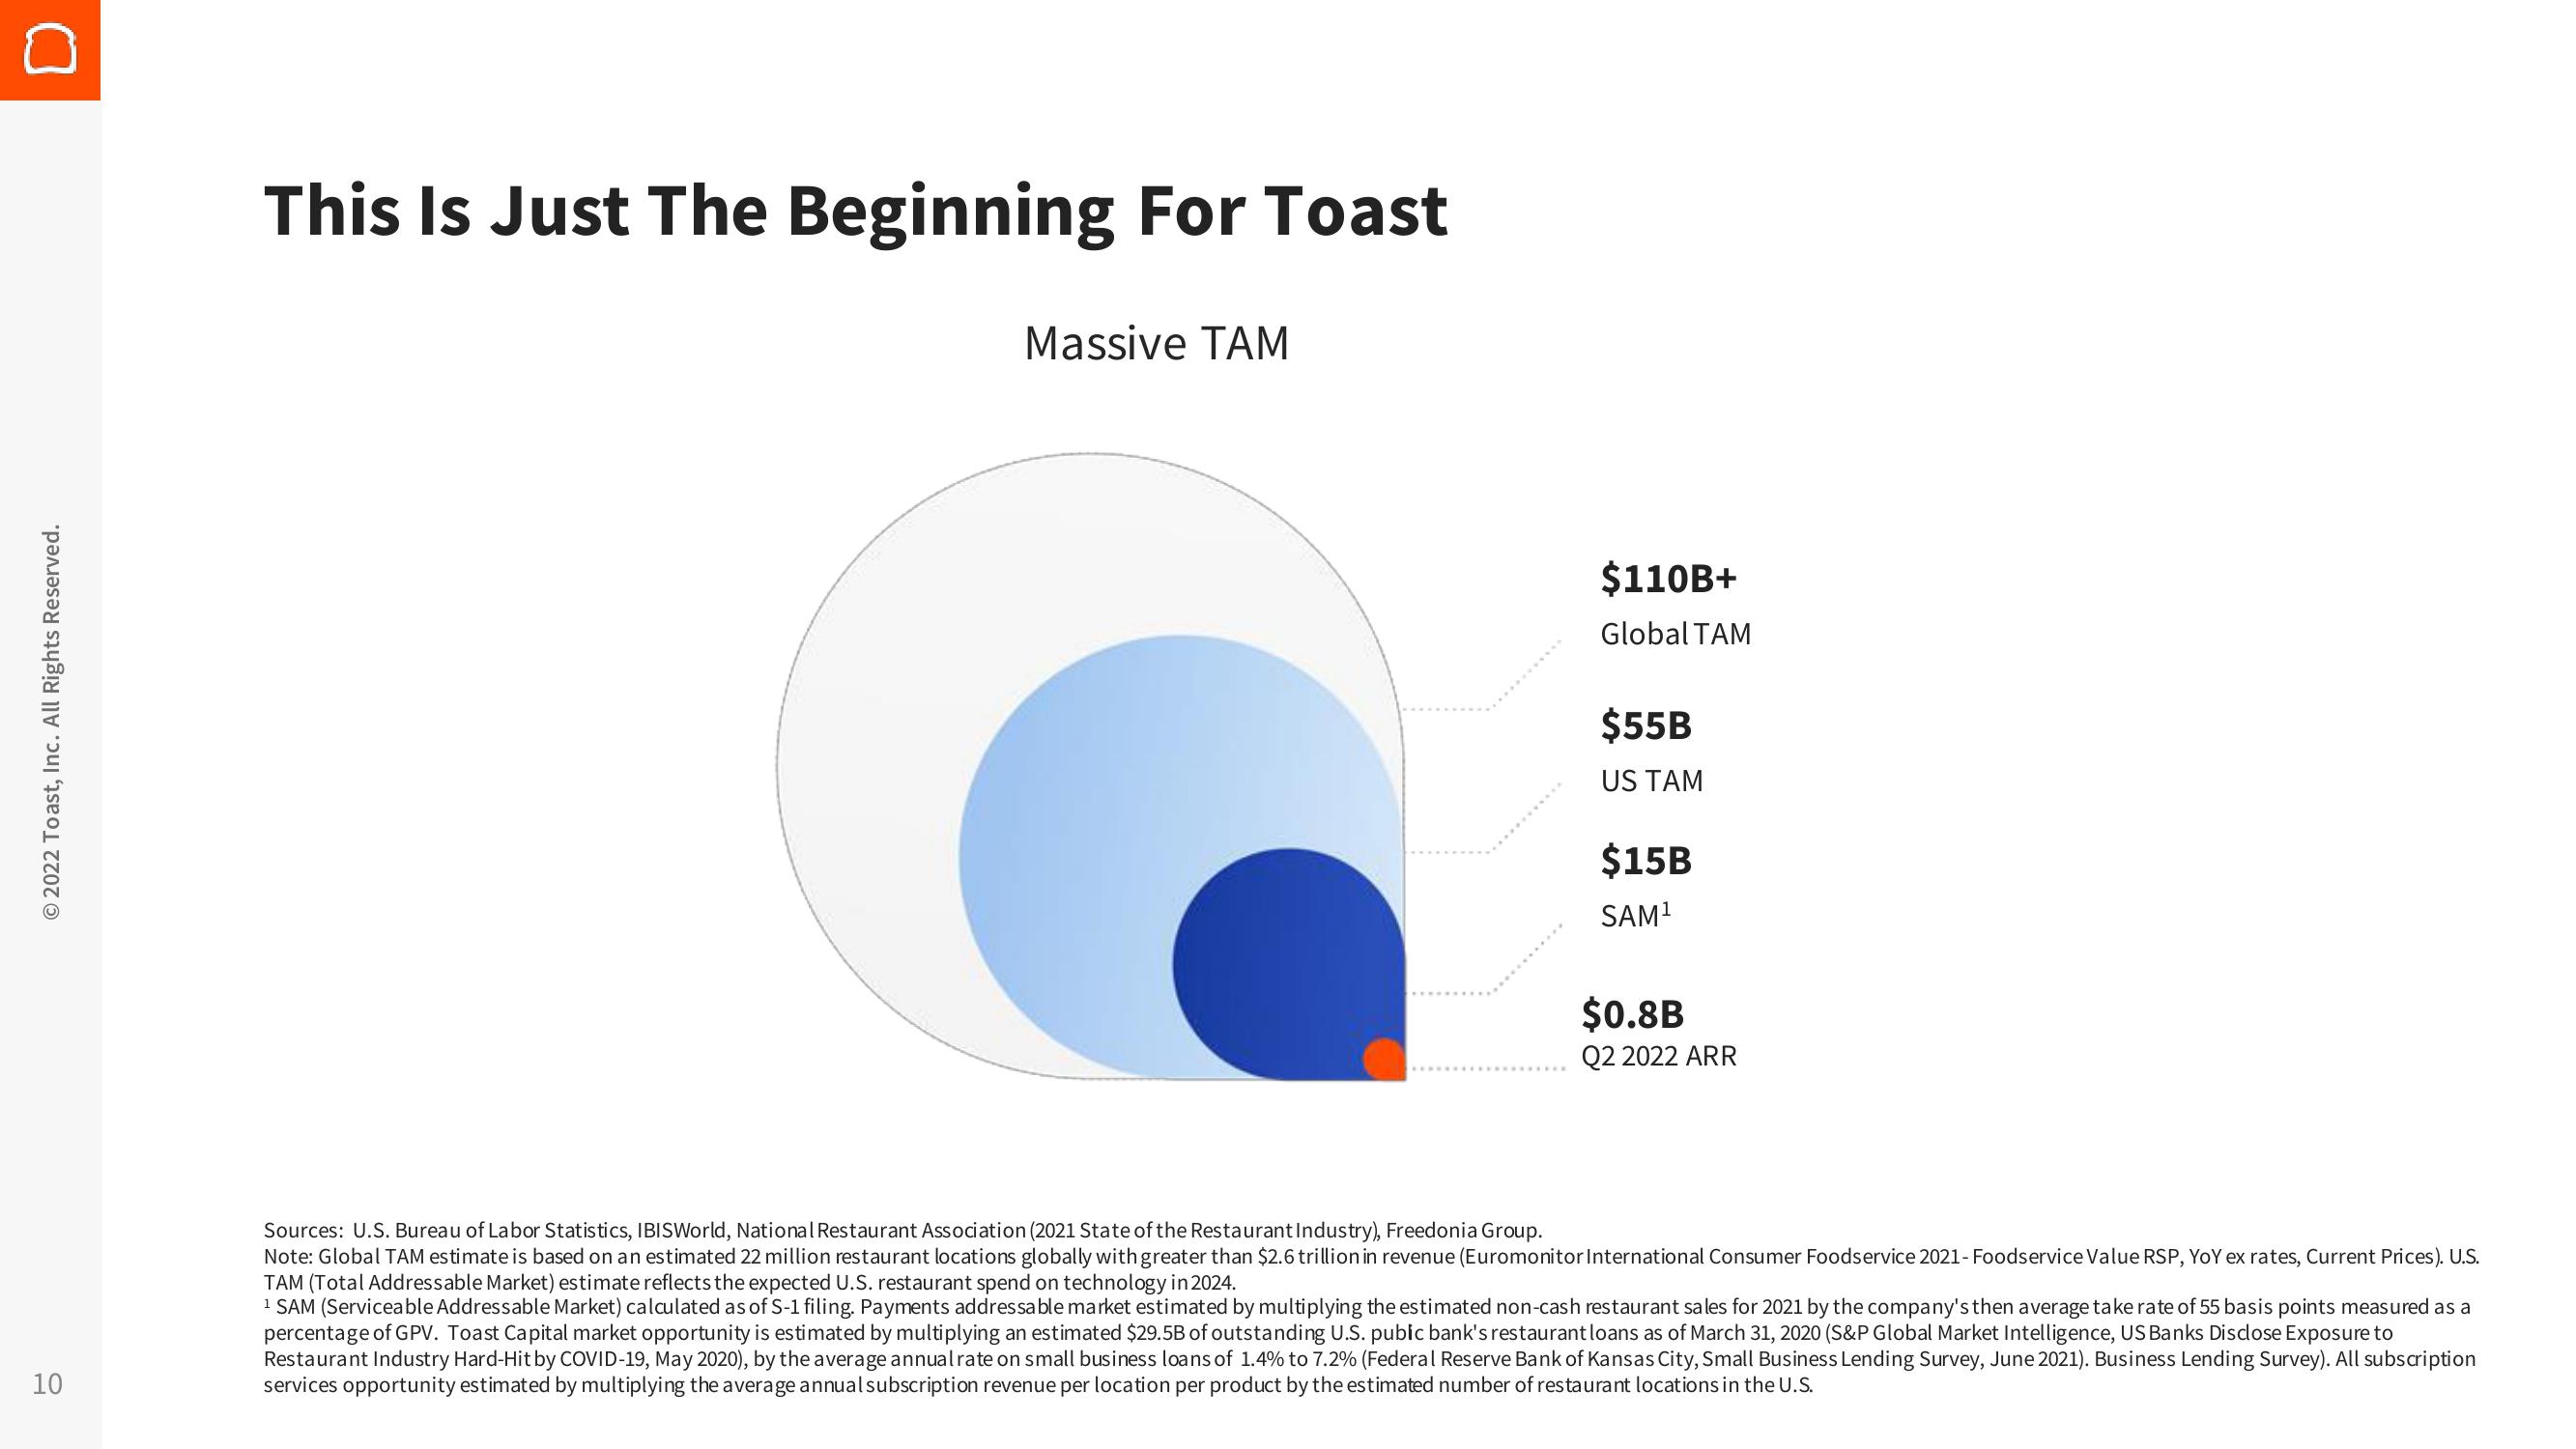
Massive TAM
$110B+
Global TAM
$55B
US TAM
$15B
SAM¹
$0.8B
Q2 2022 ARR
Sources: U.S. Bureau of Labor Statistics, IBISWorld, National Restaurant Association (2021 State of the Restaurant Industry), Freedonia Group.
Note: Global TAM estimate is based on an estimated 22 million restaurant locations globally with greater than $2.6 trillion in revenue (Euromonitor International Consumer Foodservice 2021- Foodservice Value RSP, YOY ex rates, Current Prices). U.S.
TAM (Total Addressable Market) estimate reflects the expected U.S. restaurant spend on technology in 2024.
¹ SAM (Serviceable Addressable Market) calculated as of S-1 filing. Payments addressable market estimated by multiplying the estimated non-cash restaurant sales for 2021 by the company's then average take rate of 55 basis points measured as a
percentage of GPV. Toast Capital market opportunity is estimated by multiplying an estimated $29.5B of outstanding U.S. pubic bank's restaurant loans as of March 31, 2020 (S&P Global Market Intelligence, US Banks Disclose Exposure to
Restaurant Industry Hard-Hit by COVID-19, May 2020), by the average annual rate on small business loans of 1.4% to 7.2% (Federal Reserve Bank of Kansas City, Small Business Lending Survey, June 2021). Business Lending Survey). All subscription
services opportunity estimated by multiplying the average annual subscription revenue per location per product by the estimated number of restaurant locations in the U.S.View entire presentation