Ford Investor Conference
Company
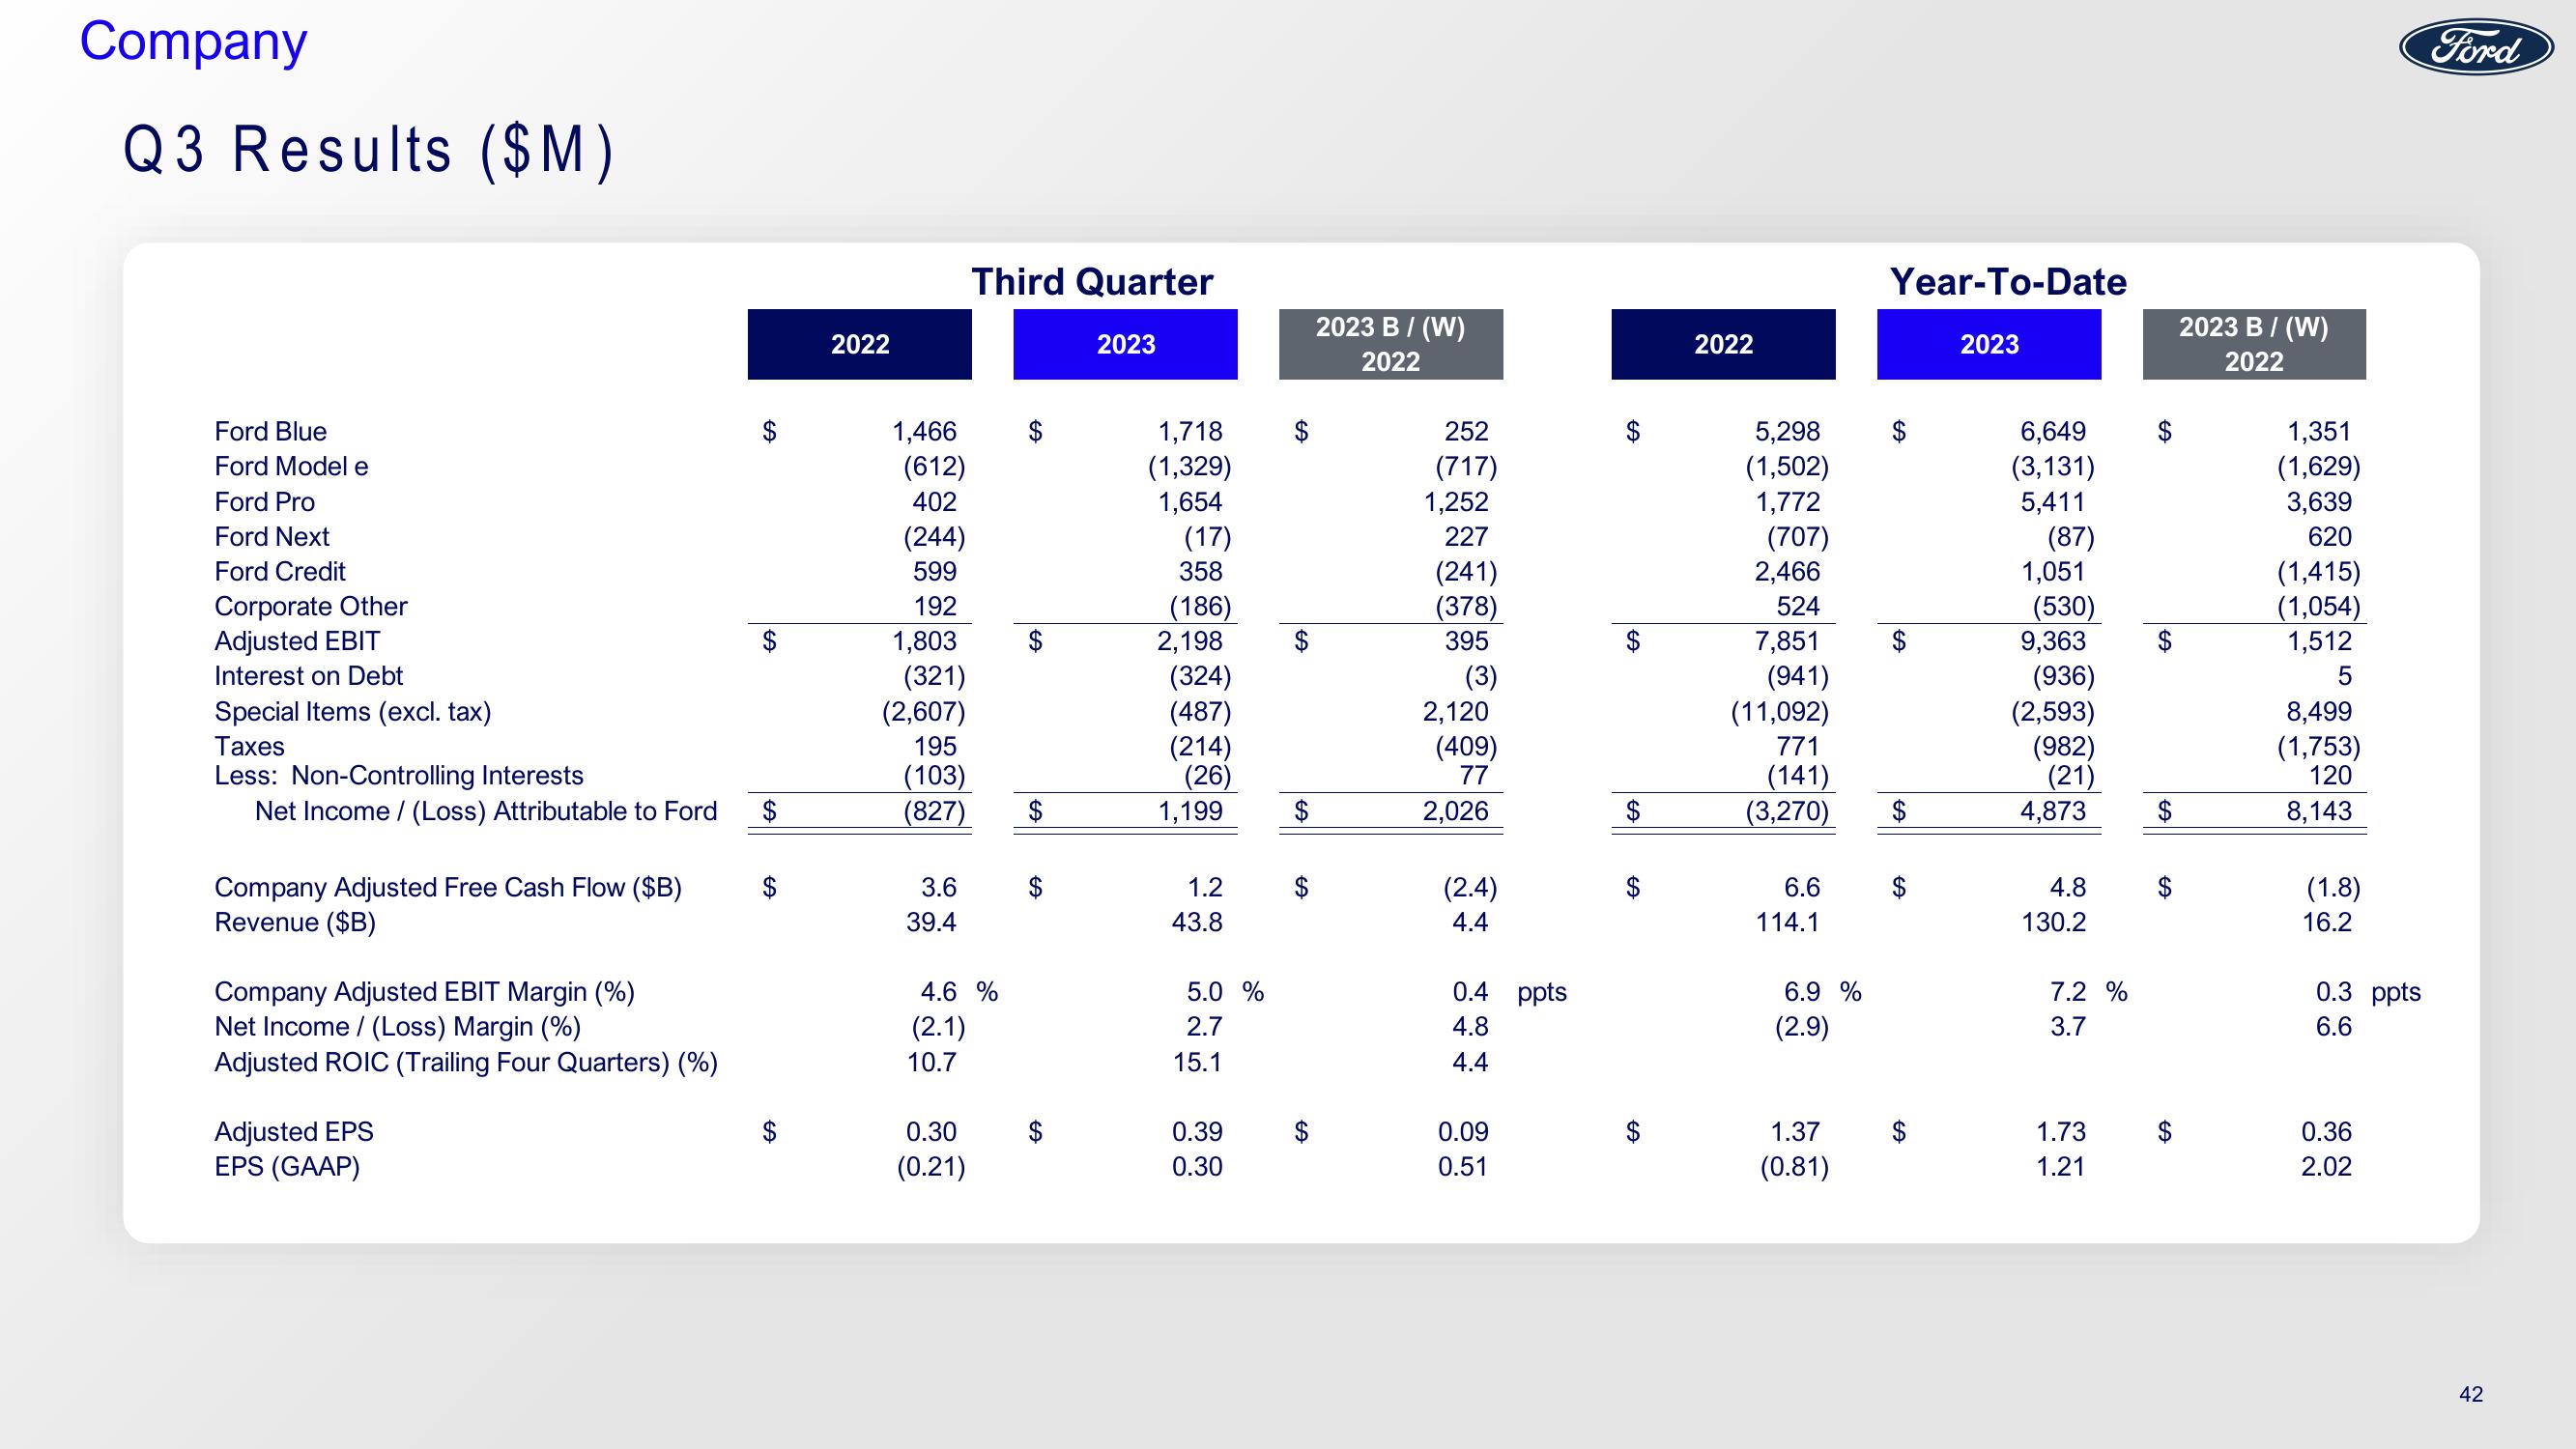
Q3 Results ($M)
Ford Blue
Ford Model e
Ford Pro
Ford Next
Ford Credit
Corporate Other
Adjusted EBIT
Interest on Debt
Special Items (excl. tax)
Taxes
Less: Non-Controlling Interests
Net Income / (Loss) Attributable to Ford
Company Adjusted Free Cash Flow ($B)
Revenue ($B)
Company Adjusted EBIT Margin (%)
Net Income / (Loss) Margin (%)
Adjusted ROIC (Trailing Four Quarters) (%)
Adjusted EPS
EPS (GAAP)
$
A
2022
1,466
(612)
402
(244)
599
192
1,803
(321)
(2,607)
195
(103)
(827)
3.6
39.4
Third Quarter
4.6 %
(2.1)
10.7
0.30
(0.21)
LA
GA
LA
2023
1,718
(1,329)
1,654
(17)
358
(186)
2,198
(324)
(487)
(214)
(26)
1,199
1.2
43.8
5.0 %
2.7
15.1
0.39
0.30
$
CA
2023 B/ (W)
2022
252
(717)
1,252
227
(241)
(378)
395
(3)
2,120
(409)
77
2,026
(2.4)
4.4
0.4 ppts
4.8
4.4
0.09
0.51
LA
GA
SA
2022
5,298
(1,502)
1,772
(707)
2,466
524
7,851
(941)
(11,092)
771
(141)
(3,270) $
6.6
114.1
6.9 %
(2.9)
Year-To-Date
1.37
(0.81)
2023
6,649
(3,131)
5,411
(87)
1,051
(530)
9,363
(936)
(2,593)
(982)
(21)
4,873
4.8
130.2
7.2 %
3.7
1.73
1.21
SA
2023 B/(W)
2022
1,351
(1,629)
3,639
620
(1,415)
(1,054)
1,512
5
8,499
(1,753)
120
8,143
(1.8)
16.2
0.3 ppts
6.6
0.36
2.02
Ford
42View entire presentation