Cloudera Investor Presentation Deck
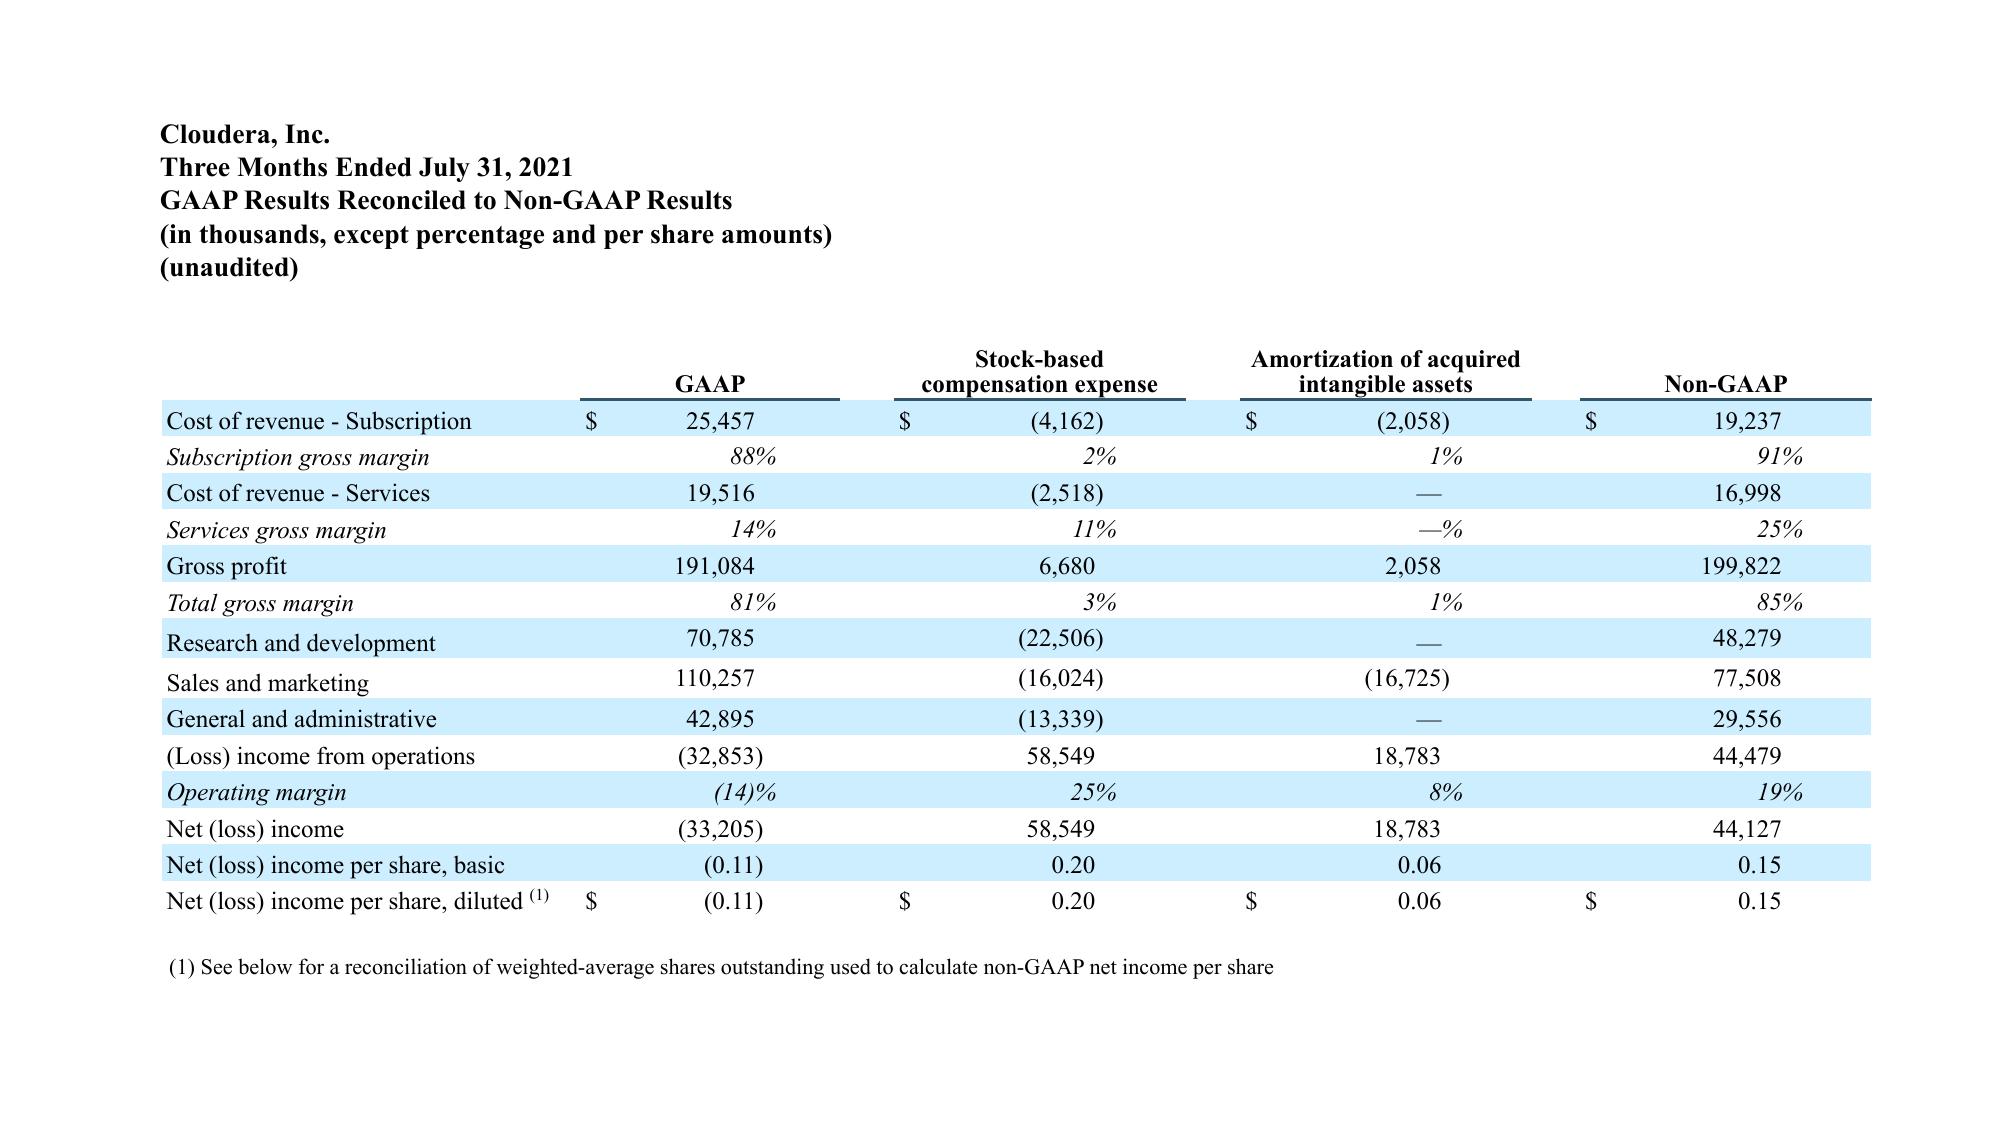
Cloudera, Inc.
Three Months Ended July 31, 2021
GAAP Results Reconciled to Non-GAAP Results
(in thousands, except percentage and per share amounts)
(unaudited)
Cost of revenue - Subscription
Subscription gross margin
Cost of revenue - Services
$
Services gross margin
Gross profit
Total gross margin
Research and development
Sales and marketing
General and administrative
(Loss) income from operations
Operating margin
Net (loss) income
Net (loss) income per share, basic
Net (loss) income per share, diluted (¹) $
GAAP
25,457
88%
19,516
14%
191,084
81%
70,785
110,257
42,895
(32,853)
(14)%
(33,205)
(0.11)
(0.11)
$
$
Stock-based
compensation expense
(4,162)
2%
(2,518)
11%
6,680
3%
(22,506)
(16,024)
(13,339)
58,549
25%
58,549
0.20
0.20
Amortization of acquired
intangible assets
(2,058)
$
$
(1) See below for a reconciliation of weighted-average shares outstanding used to calculate non-GAAP net income per share
1%
-%
2,058
1%
(16,725)
18,783
8%
18,783
0.06
0.06
$
$
Non-GAAP
19,237
91%
16,998
25%
199,822
85%
48,279
77,508
29,556
44,479
19%
44,127
0.15
0.15View entire presentation