Melrose Results Presentation Deck
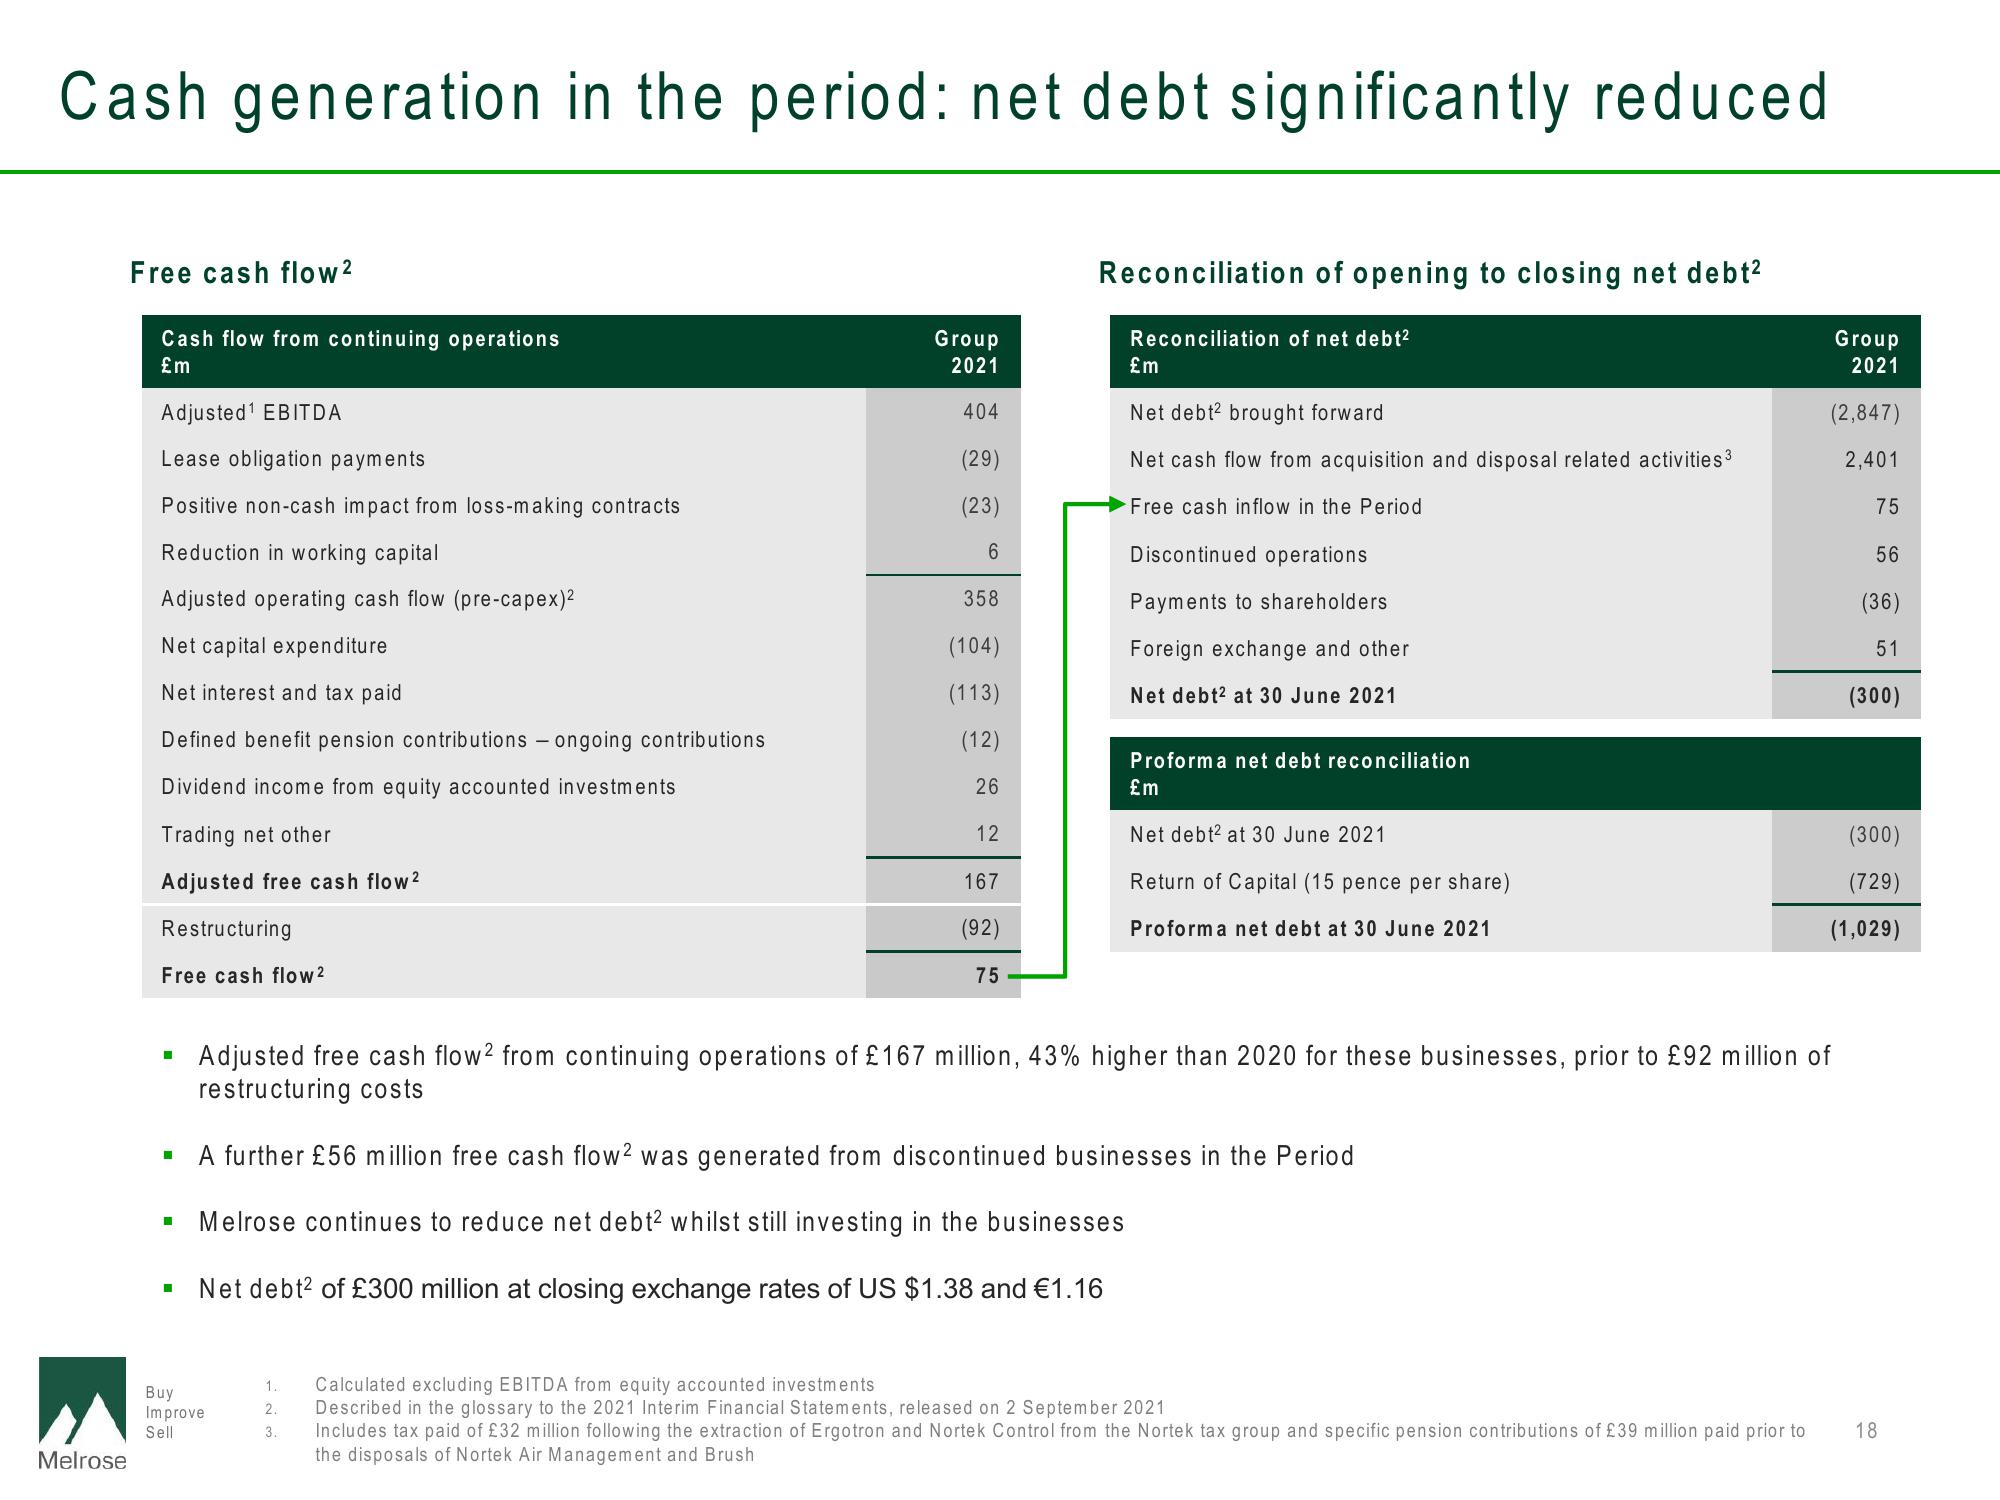
Cash generation in the period: net debt significantly reduced
Melrose
Free cash flow ²
Cash flow from continuing operations
£m
Adjusted¹ EBITDA
Lease obligation payments
Positive non-cash impact from loss-making contracts
Reduction in working capital
Adjusted operating cash flow (pre-capex)²
Net capital expenditure
Net interest and tax paid
Defined benefit pension contributions - ongoing contributions
Dividend income from equity accounted investments
Trading net other
Adjusted free cash flow ²
Restructuring
Free cash flow 2
■
I
I
I
Group
2021
404
(29)
(23)
6
Buy
Improve
Sell
358
(104)
(113)
(12)
26
1.
2.
3.
12
167
(92)
75
Reconciliation of opening to closing net debt²
Reconciliation of net debt²
£m
Net debt² brought forward
Net cash flow from acquisition and disposal related activities ³
Free cash inflow in the Period
Discontinued operations
Payments to shareholders
Foreign exchange and other
Net debt² at 30 June 2021
Proforma net debt reconciliation
£m
Net debt2 at 30 June 2021
Return of Capital (15 pence per share)
Proforma net debt at 30 June 2021
A further £56 million free cash flow2 was generated from discontinued businesses in the Period
Melrose continues to reduce net debt² whilst still investing in the businesses
Net debt² of £300 million at closing exchange rates of US $1.38 and €1.16
Adjusted free cash flow2 from continuing operations of £167 million, 43% higher than 2020 for these businesses, prior to £92 million of
restructuring costs
Group
2021
(2,847)
2,401
75
56
(36)
51
(300)
(300)
(729)
(1,029)
Calculated excluding EBITDA from equity accounted investments
Described in the glossary to the 2021 Interim Financial Statements, released on 2 September 2021
Includes tax paid of £32 million following the extraction of Ergotron and Nortek Control from the Nortek tax group and specific pension contributions of £39 million paid prior to 18
the disposals of Nortek Air Management and BrushView entire presentation