Zegna Results Presentation Deck
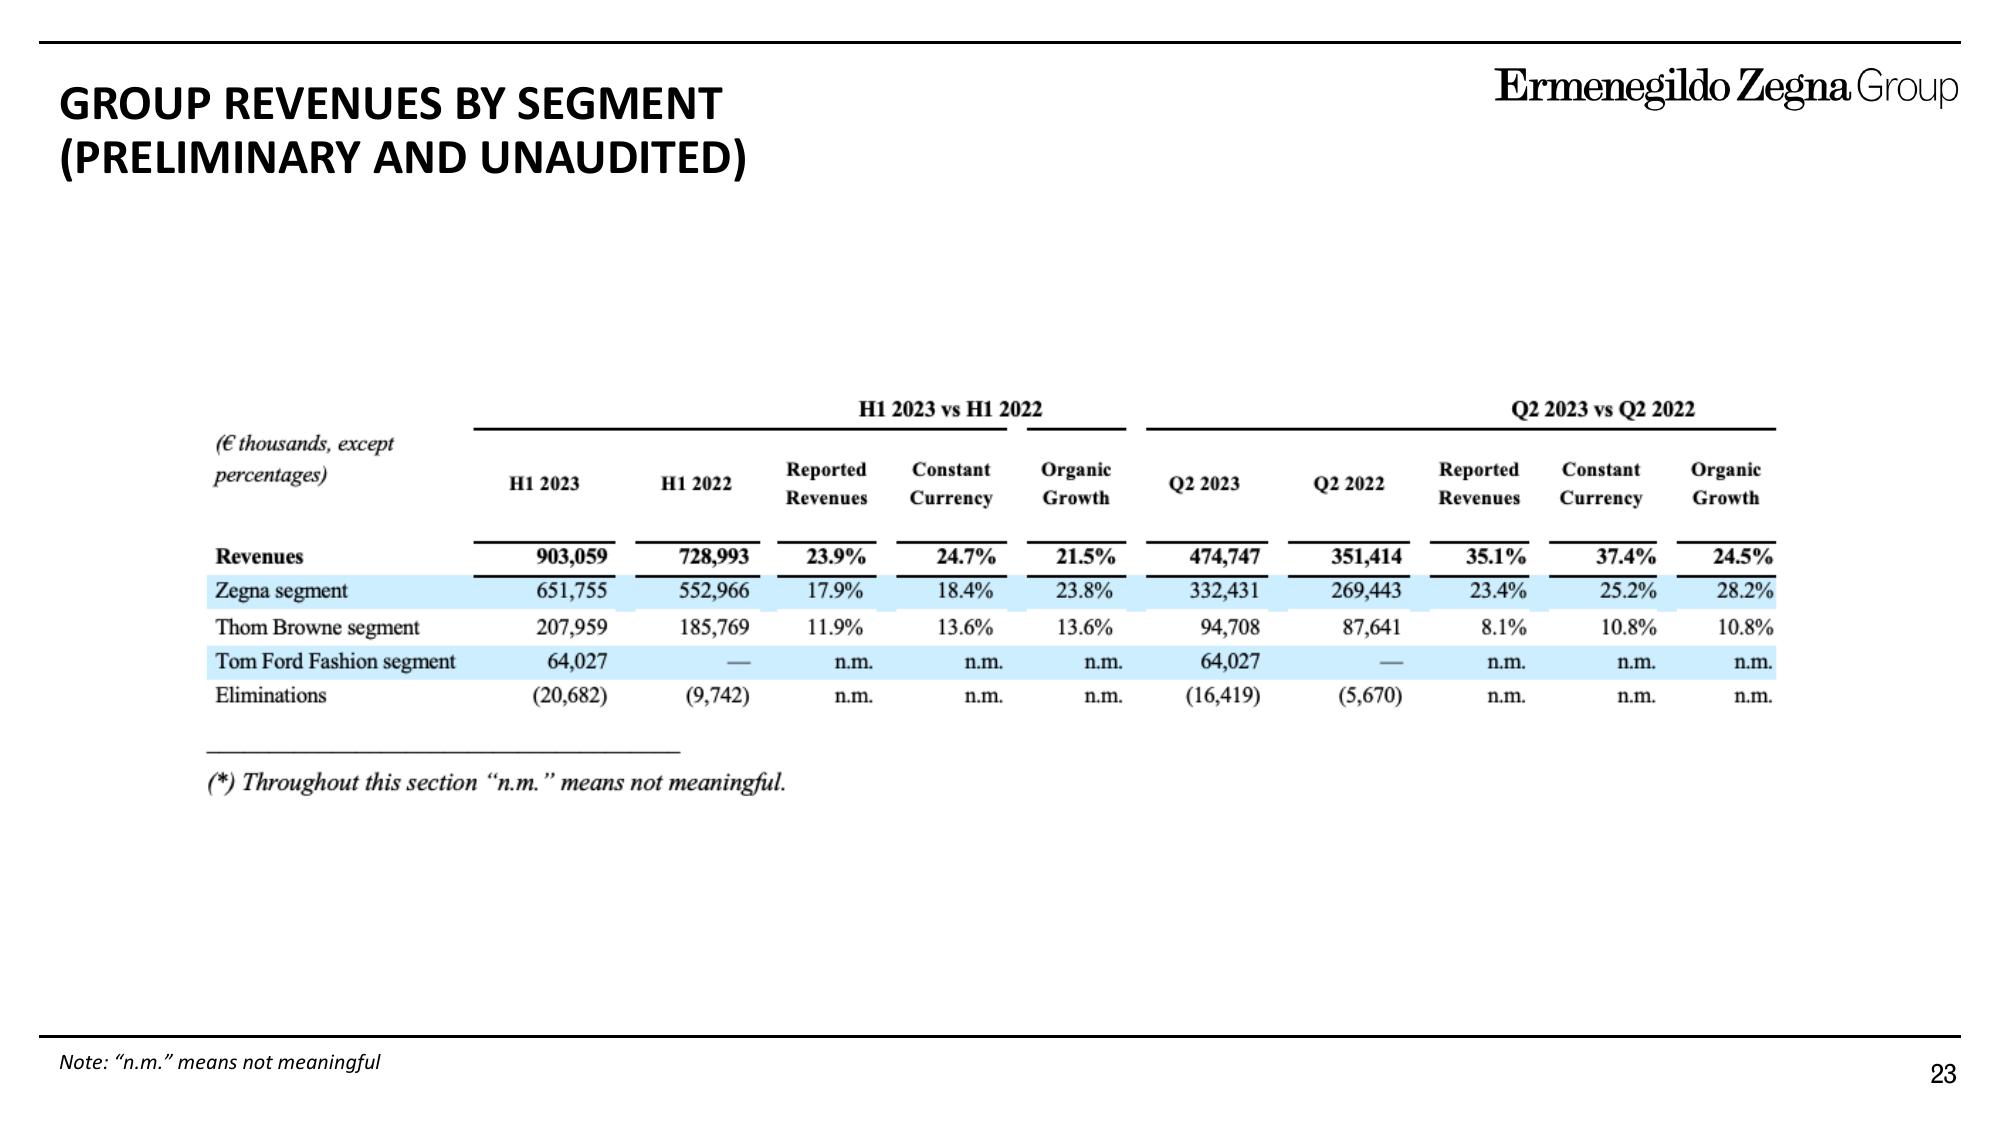
GROUP REVENUES BY SEGMENT
(PRELIMINARY AND UNAUDITED)
(€ thousands, except
percentages)
Revenues
Zegna segment
Thom Browne segment
Tom Ford Fashion segment
Eliminations
H1 2023
Note: "n.m." means not meaningful
903,059
651,755
207,959
64,027
(20,682)
H1 2022
728,993
552,966
185,769
(9,742)
(*) Throughout this section "n.m. means not meaningful.
H1 2023 vs H1 2022
Reported Constant
Revenues Currency
23.9%
17.9%
11.9%
n.m.
n.m.
24.7%
18.4%
13.6%
n.m.
n.m.
Organic
Growth
21.5%
23.8%
13.6%
n.m.
n.m.
Q2 2023
474,747
332,431
94,708
64,027
(16,419)
Q2 2022
351,414
269,443
87,641
(5,670)
Ermenegildo Zegna Group
Q2 2023 vs Q2 2022
Reported Constant Organic
Revenues Currency Growth
35.1%
23.4%
8.1%
n.m.
n.m.
37.4%
25.2%
10.8%
n.m.
n.m.
24.5%
28.2%
10.8%
n.m.
n.m.
23View entire presentation