Kinnevik Results Presentation Deck
Intro
SEK m
GROUP FINANCIAL STATEMENTS
Change in Fair Value of Financial Assets
Dividends Received
Consolidated Income Statement and Report Concerning Total Comprehensive Income
Administration Costs
Other Operating Income
Other Operating Expenses
Operating Profit/Loss
Net Asset Value
Interest Income and Other Financial Income
Interest Expenses and Other Financial Expenses
Profit/Loss after Financial Net
Tax
Net Profit/Loss for the Period
Total Comprehensive Income for the Period
Net Profit/Loss per Share Before Dilution, SEK
Net Profit/Loss per Share After Dilution, SEK
Outstanding Shares at the End of the Period
Average Number of Shares Before Dilution
Average Number of Shares After Dilution
KINNEVIK
Portfolio Overview
Interim Report Q1 2023
Note
Sustainability
4
5
Q1 2023
2 559
-75
2
0
2 486
111
-51
2 546
0
2 546
2 546
9.09
9.09
280 076 174
280 076 174
280 076 174
Q1 2022
-4 589
-58
2
0
-4 645
159
-55
-4 541
0
-4 541
-4 541
-16.29
-16.29
278 677 265
278 677 265
278 677 265
FY 2022
-22 856
3 538
-371
11
-1
-19 679
346
-186
-19 519
0
-19 519
-19 519
-69.83
-69.83
280 076 174
279 503 330
279 503 330
Financial Statements
Other
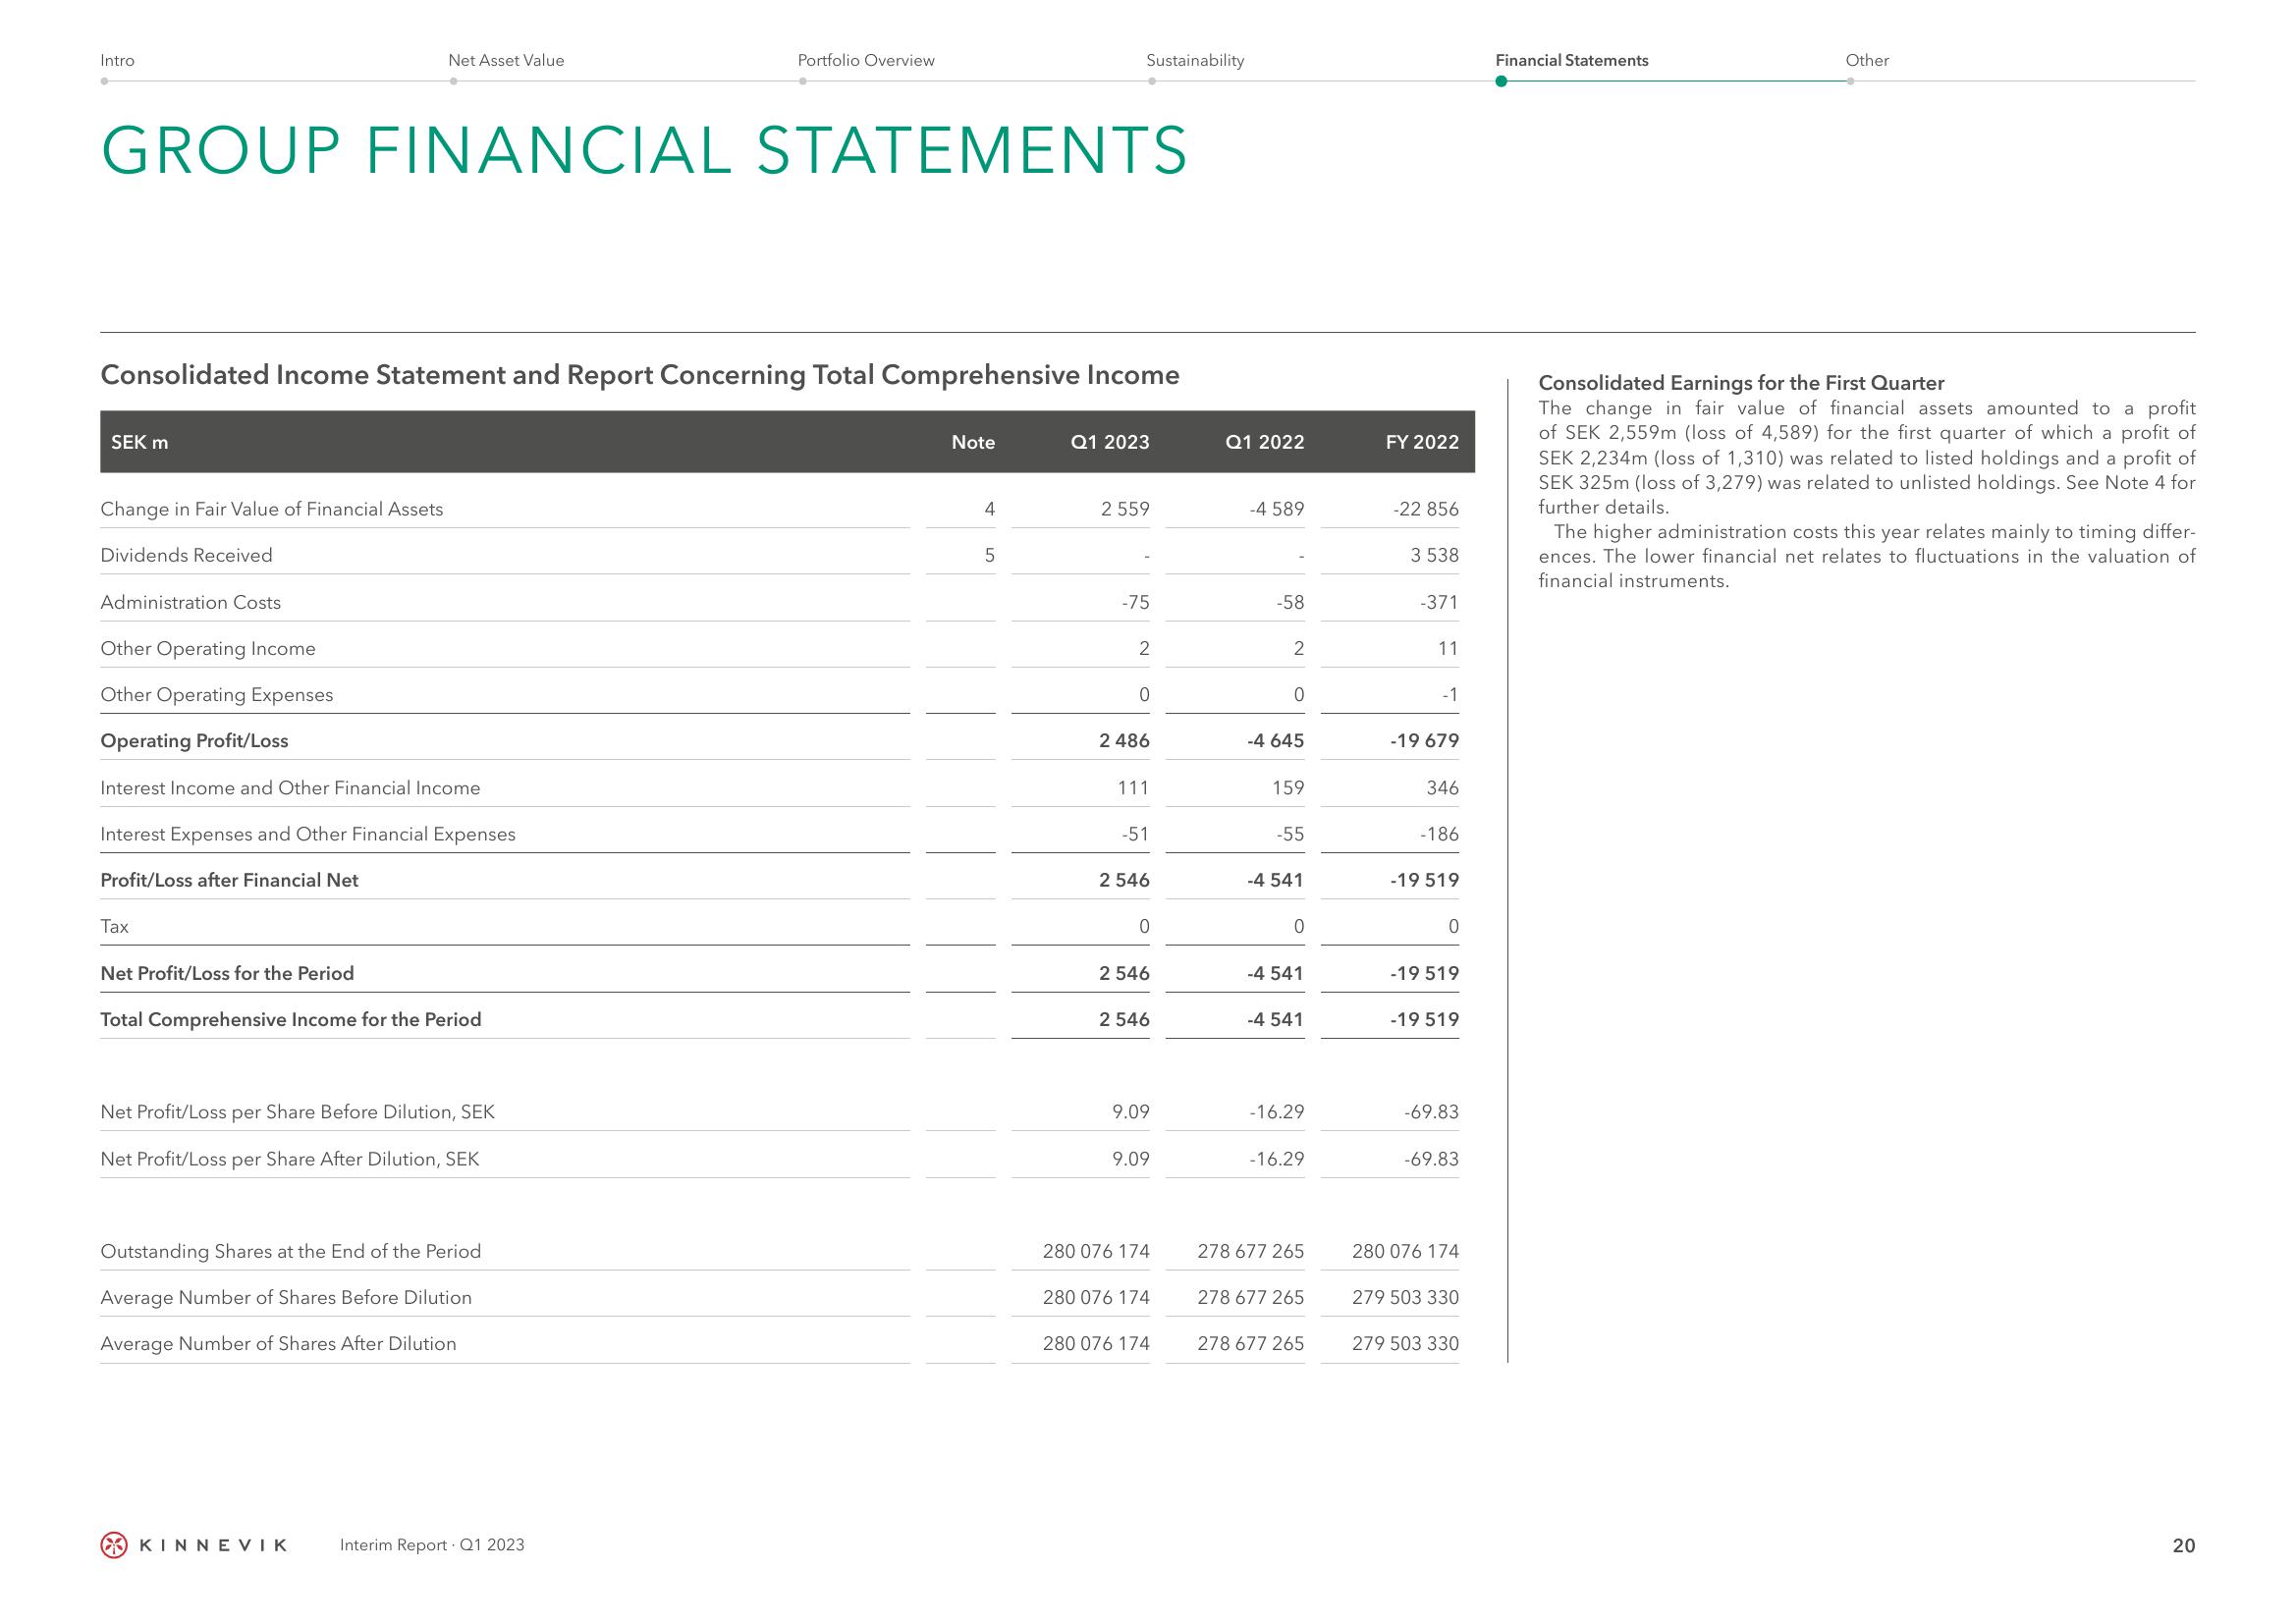
Consolidated Earnings for the First Quarter
The change in fair value of financial assets amounted to a profit
of SEK 2,559m (loss of 4,589) for the first quarter of which a profit of
SEK 2,234m (loss of 1,310) was related to listed holdings and a profit of
SEK 325m (loss of 3,279) was related to unlisted holdings. See Note 4 for
further details.
The higher administration costs this year relates mainly to timing differ-
ences. The lower financial net relates to fluctuations in the valuation of
financial instruments.
20View entire presentation