Lanvin Results Presentation Deck
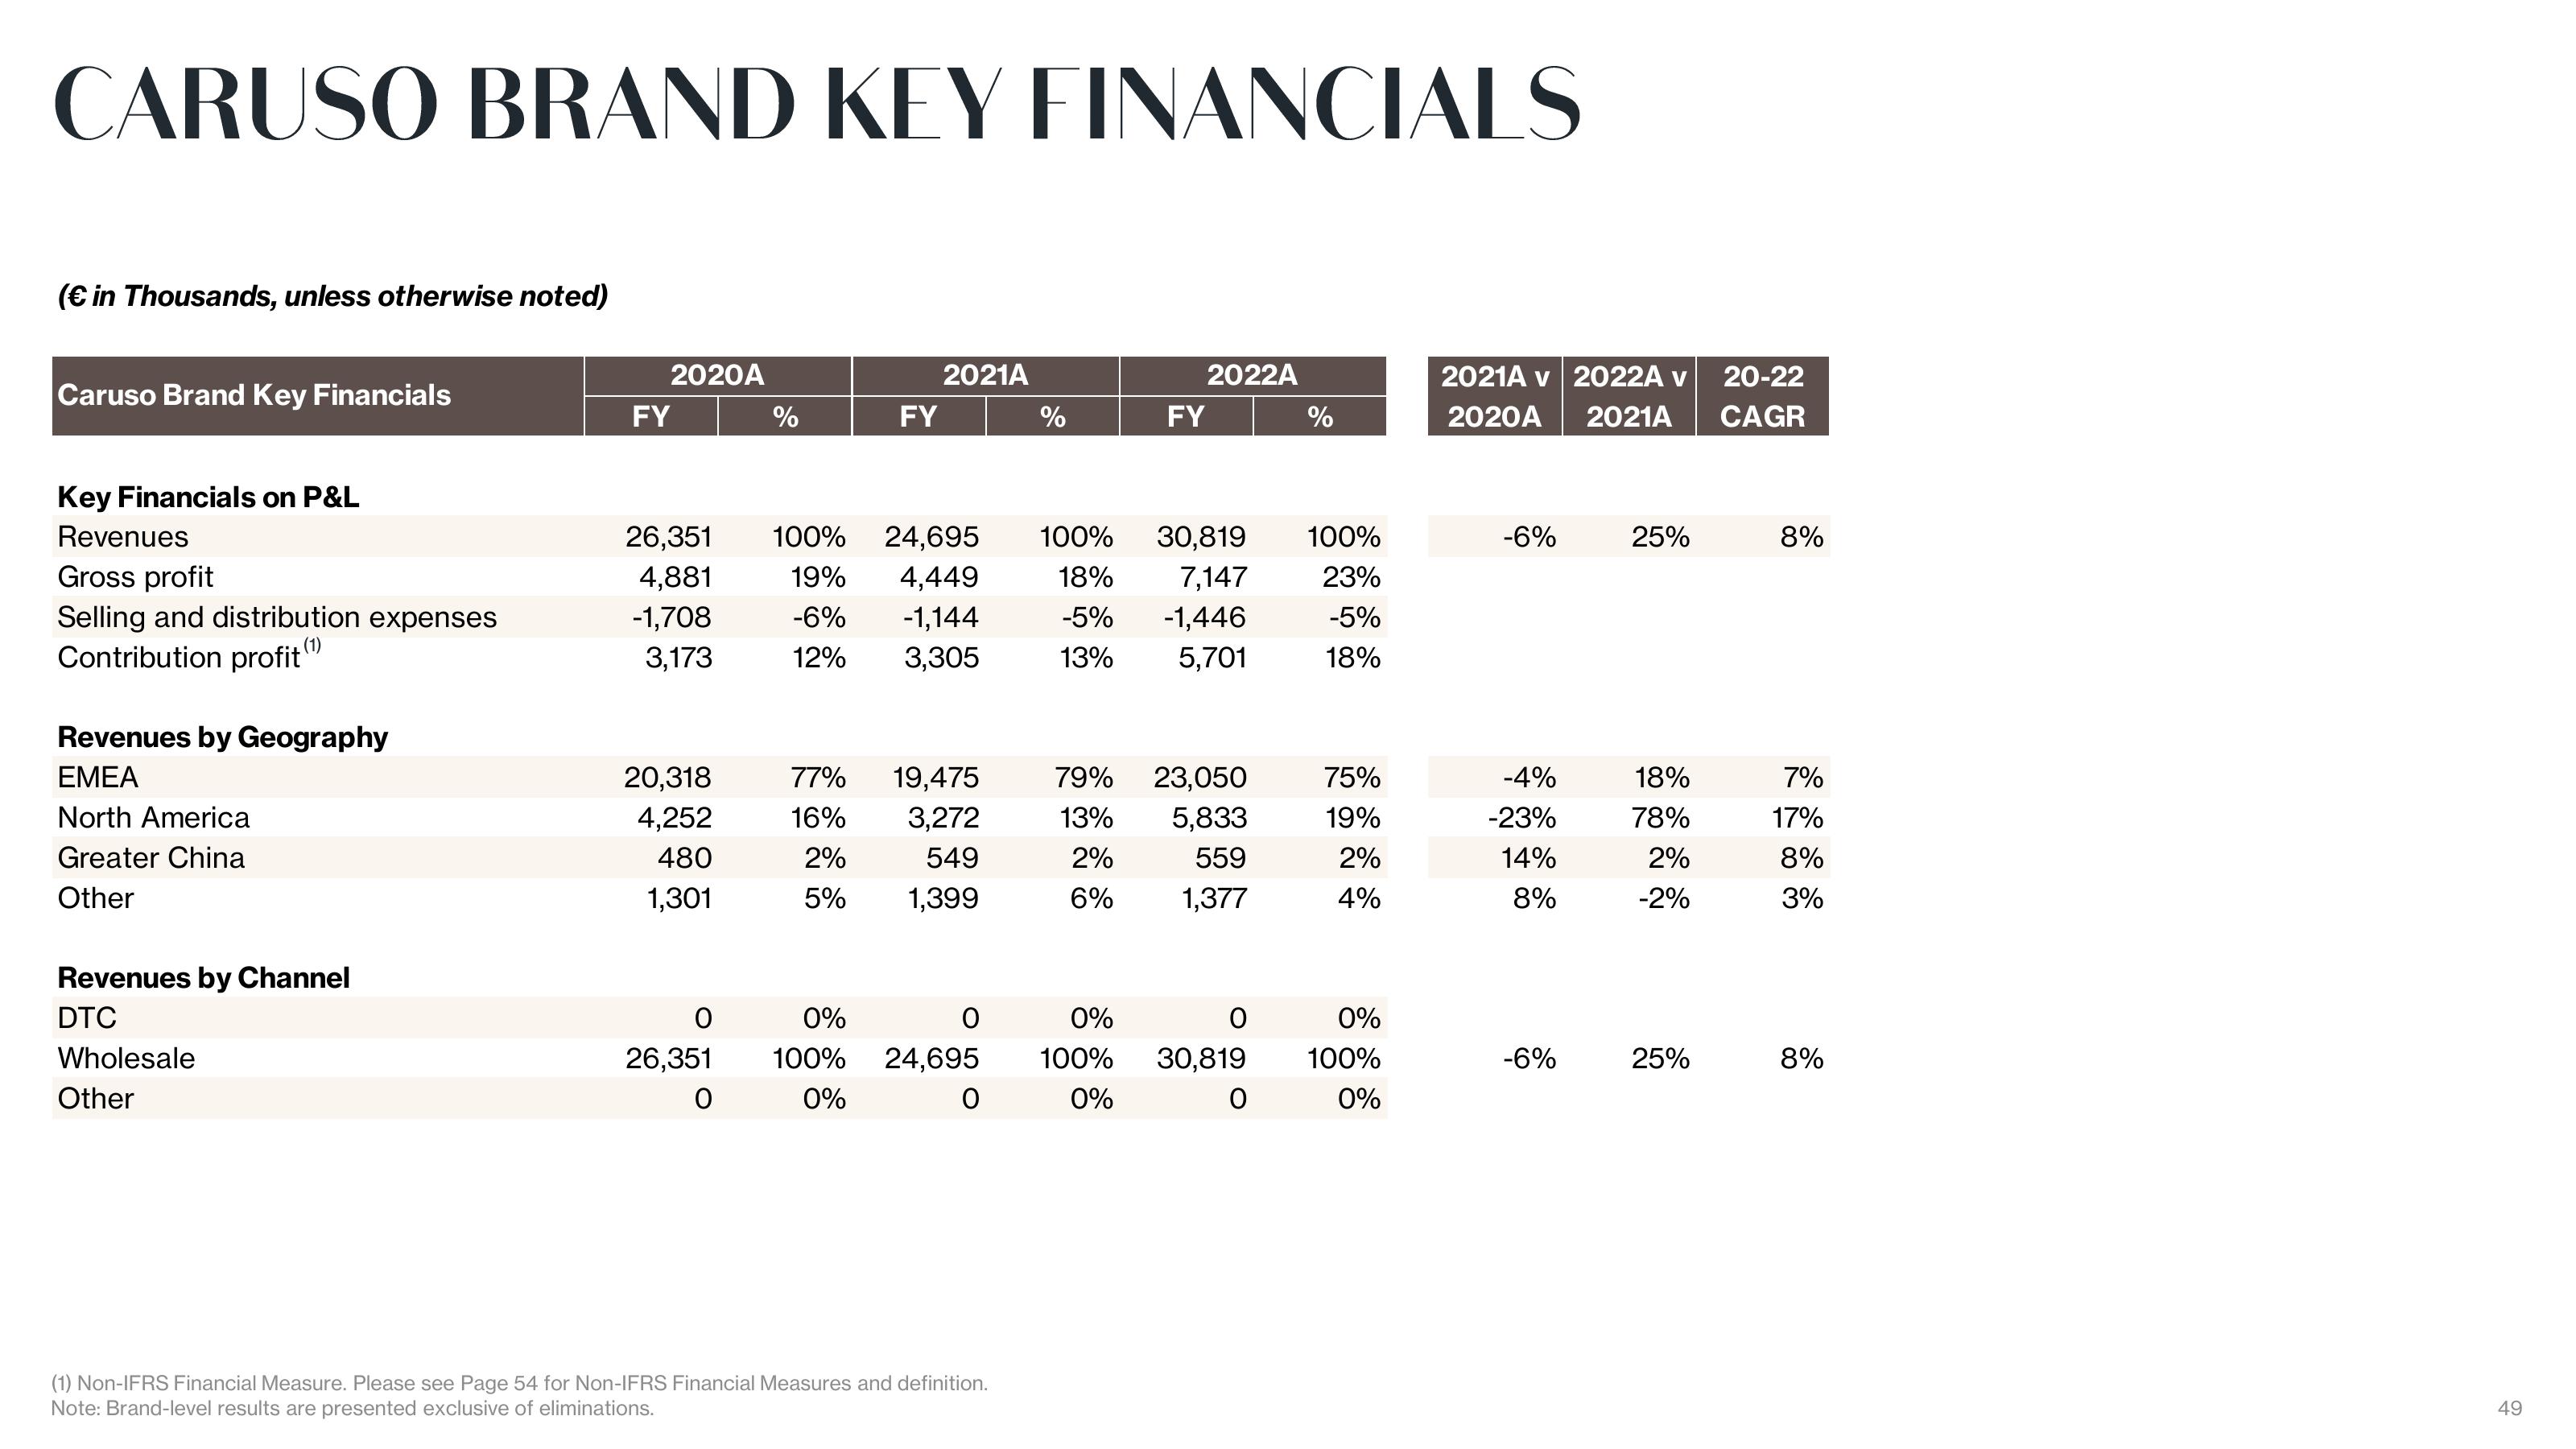
CARUSO BRAND KEY FINANCIALS
(€ in Thousands, unless otherwise noted)
Caruso Brand Key Financials
Key Financials on P&L
Revenues
Gross profit
Selling and distribution expenses
Contribution profit
Revenues by Geography
EMEA
North America
Greater China
Other
Revenues by Channel
DTC
Wholesale
Other
2020A
FY
26,351
4,881
-1,708
3,173
20,318
4,252
480
1,301
O
26,351
O
%
FY
2021A
77% 19,475
16%
2%
5% 1,399
3,272
549
O
0%
100% 24,695
0%
O
%
100% 24,695 100% 30,819
19% 4,449
-6% -1,144
12% 3,305
18%
7,147
-5% -1,446
13%
5,701
(1) Non-IFRS Financial Measure. Please see Page 54 for Non-IFRS Financial Measures and definition.
Note: Brand-level results are presented exclusive of eliminations.
2022A
FY
79% 23,050
13% 5,833
2%
6% 1,377
559
O
0%
100% 30,819
0%
0
%
100%
23%
-5%
18%
75%
19%
2%
4%
0%
100%
0%
2021A v 2022A v
2020A 2021A
-6%
-4%
-23%
14%
8%
-6%
25%
18%
78%
2%
-2%
25%
20-22
CAGR
8%
7%
17%
8%
3%
8%
49View entire presentation