Fresnillo Results Presentation Deck
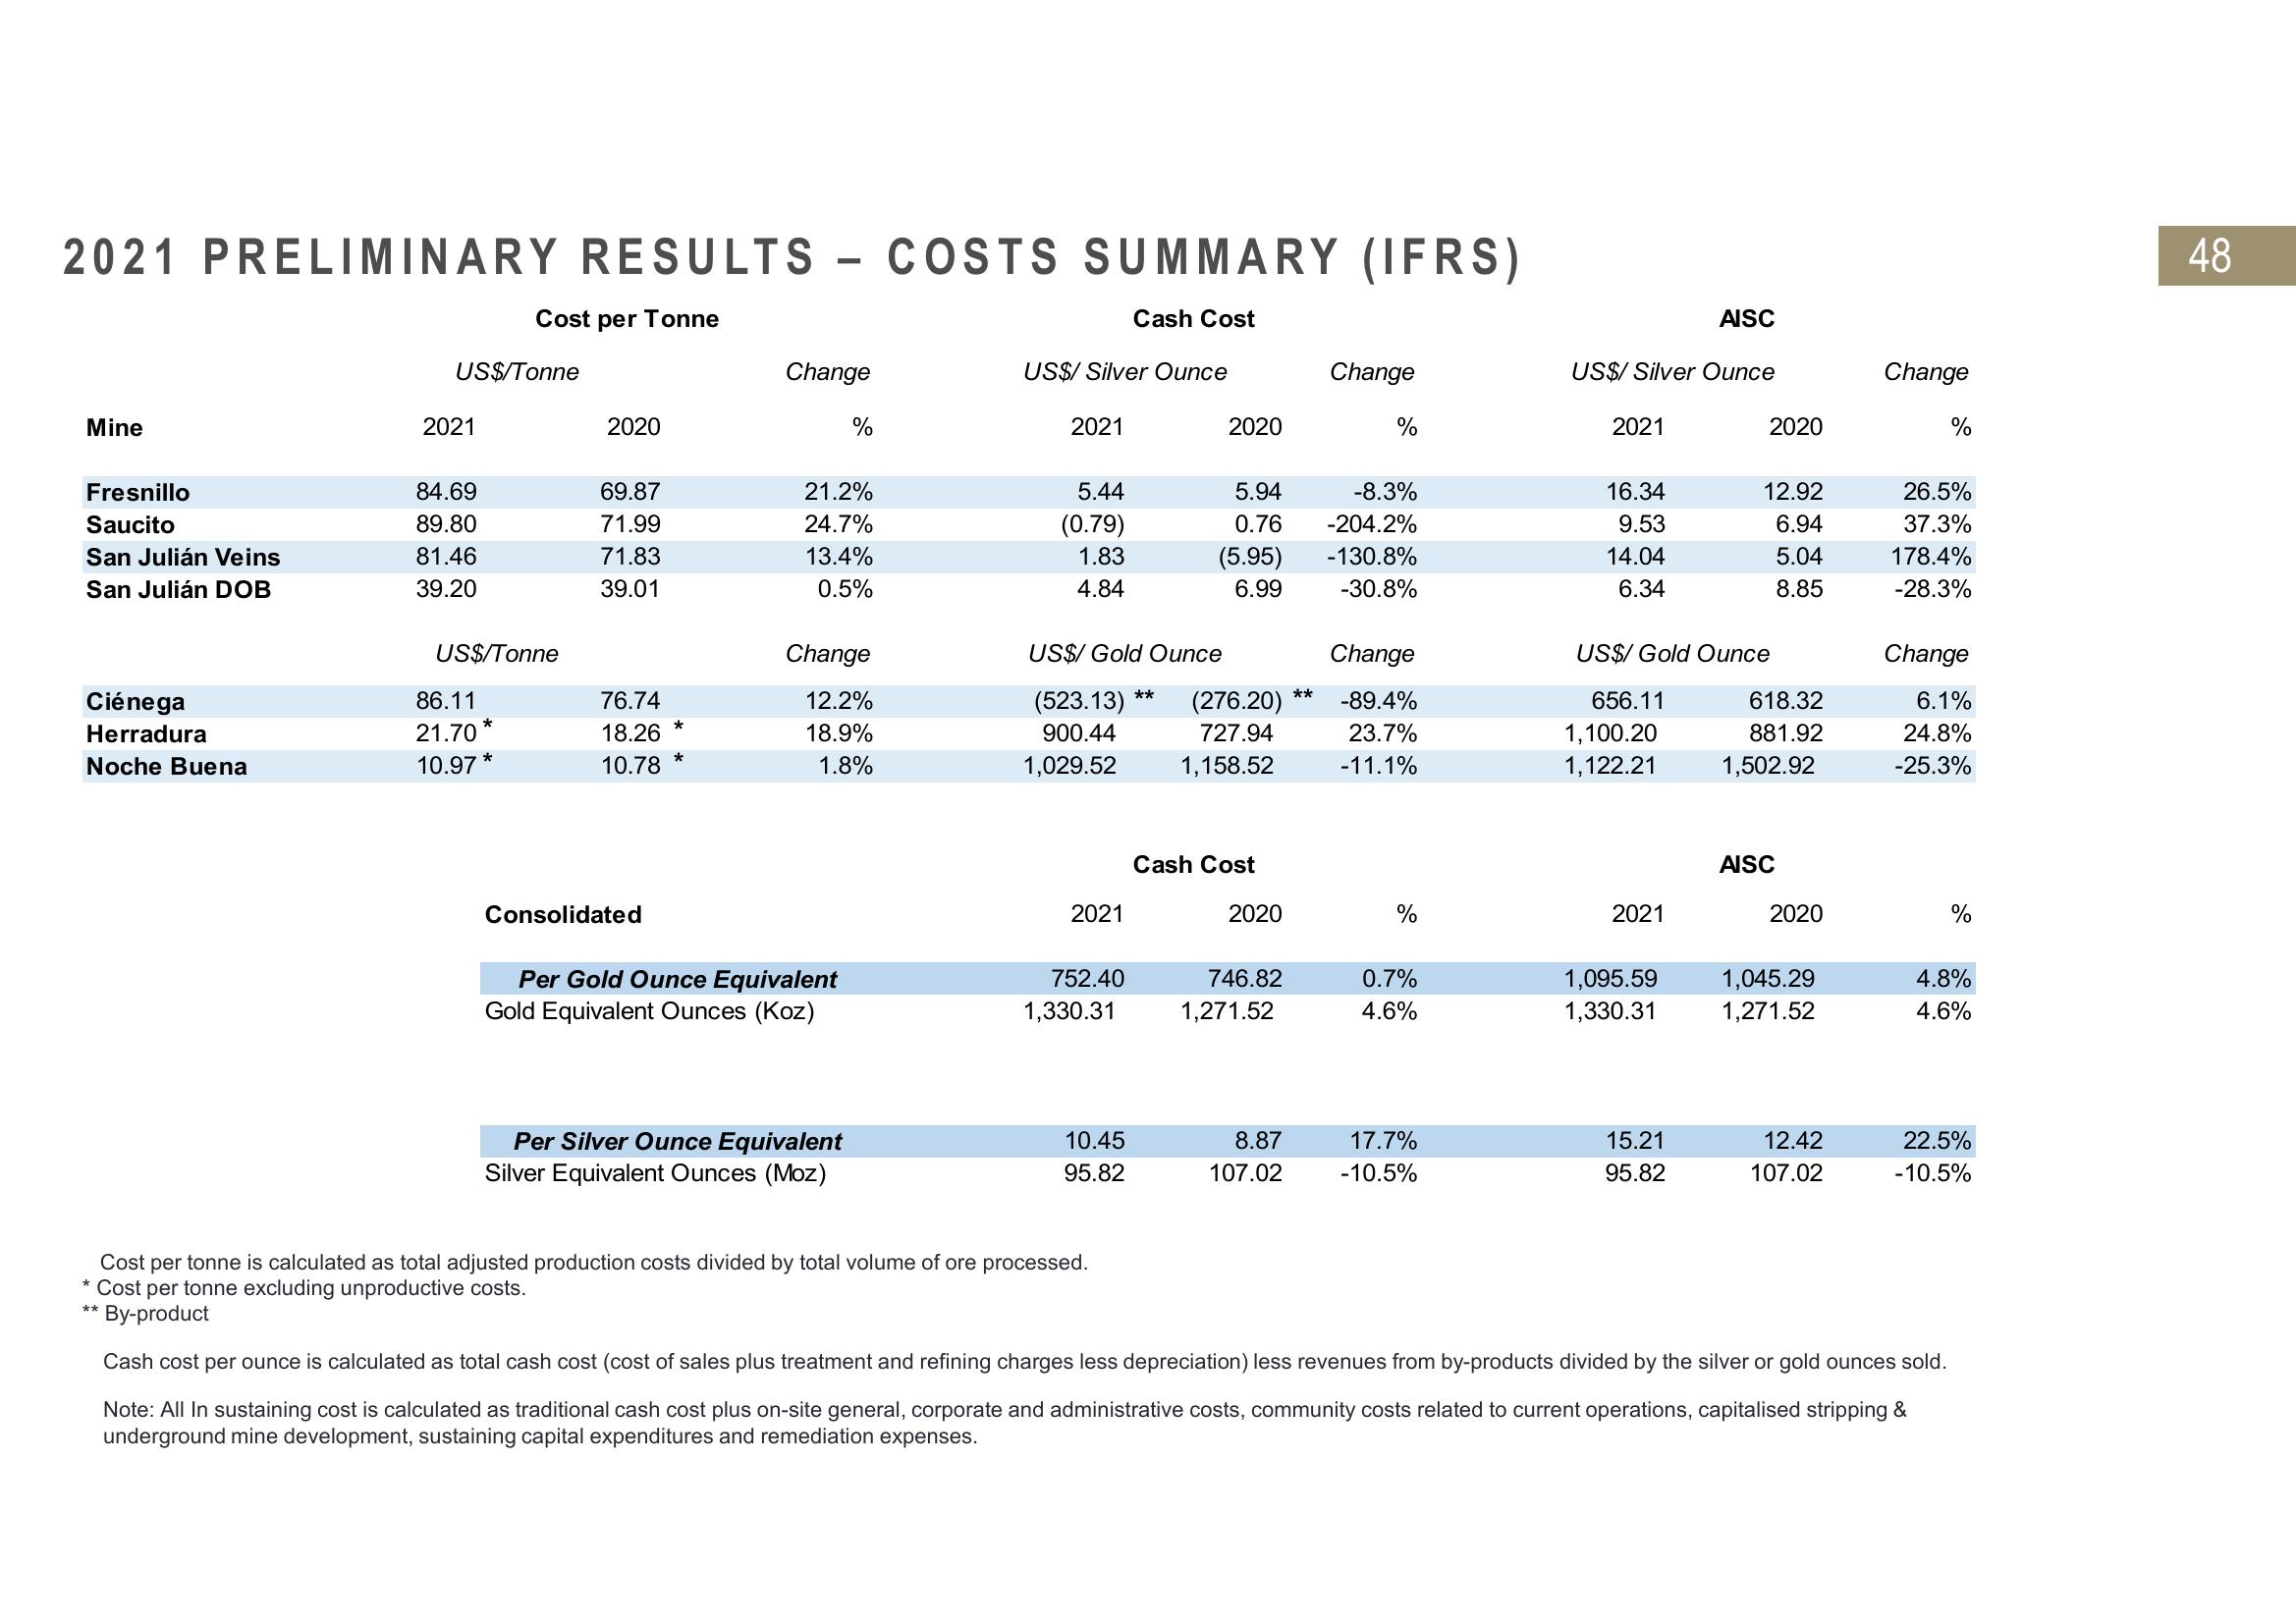
2021 PRELIMINARY RESULTS - COSTS SUMMARY
Cost per Tonne
Mine
Fresnillo
Saucito
San Julián Veins
San Julián DOB
Ciénega
Herradura
Noche Buena
US$/Tonne
**
2021
84.69
89.80
81.46
39.20
US$/Tonne
86.11
21.70
10.97*
*
2020
69.87
71.99
71.83
39.01
76.74
18.26
10.78
Consolidated
*
Change
21.2%
24.7%
13.4%
0.5%
%
Change
12.2%
18.9%
1.8%
Per Gold Ounce Equivalent
Gold Equivalent Ounces (Koz)
Per Silver Ounce Equivalent
Silver Equivalent Ounces (Moz)
COSTS SUMMARY (IFRS)
Cash Cost
US$/ Silver Ounce
2021
5.44
(0.79)
1.83
4.84
2021
752.40
1,330.31
US$/ Gold Ounce
(523.13) (276.20)
900.44
727.94
1,158.52
1,029.52
10.45
95.82
Cost per tonne is calculated total adjusted production costs divided by total volume of ore processed.
Cost per tonne excluding unproductive costs.
By-product
2020
**
5.94
0.76
(5.95)
6.99
Cash Cost
2020
746.82
1,271.52
8.87
107.02
**
Change
%
-8.3%
-204.2%
-130.8%
-30.8%
Change
-89.4%
23.7%
-11.1%
%
0.7%
4.6%
17.7%
-10.5%
US$/ Silver Ounce
2021
16.34
9.53
14.04
6.34
2021
AISC
1,095.59
1,330.31
US$/ Gold Ounce
656.11
1,100.20
1,122.21
15.21
95.82
2020
12.92
6.94
5.04
8.85
618.32
881.92
1,502.92
AISC
2020
1,045.29
1,271.52
12.42
107.02
Change
%
26.5%
37.3%
178.4%
-28.3%
Change
6.1%
24.8%
-25.3%
%
4.8%
4.6%
Cash cost per ounce is calculated as total cash cost (cost of sales plus treatment and refining charges less depreciation) less revenues from by-products divided by the silver or gold ounces sold.
Note: All In sustaining cost is calculated as traditional cash cost plus on-site general, corporate and administrative costs, community costs related to current operations, capitalised stripping &
underground mine development, sustaining capital expenditures and remediation expenses.
22.5%
-10.5%
48View entire presentation