Deutsche Bank Results Presentation Deck
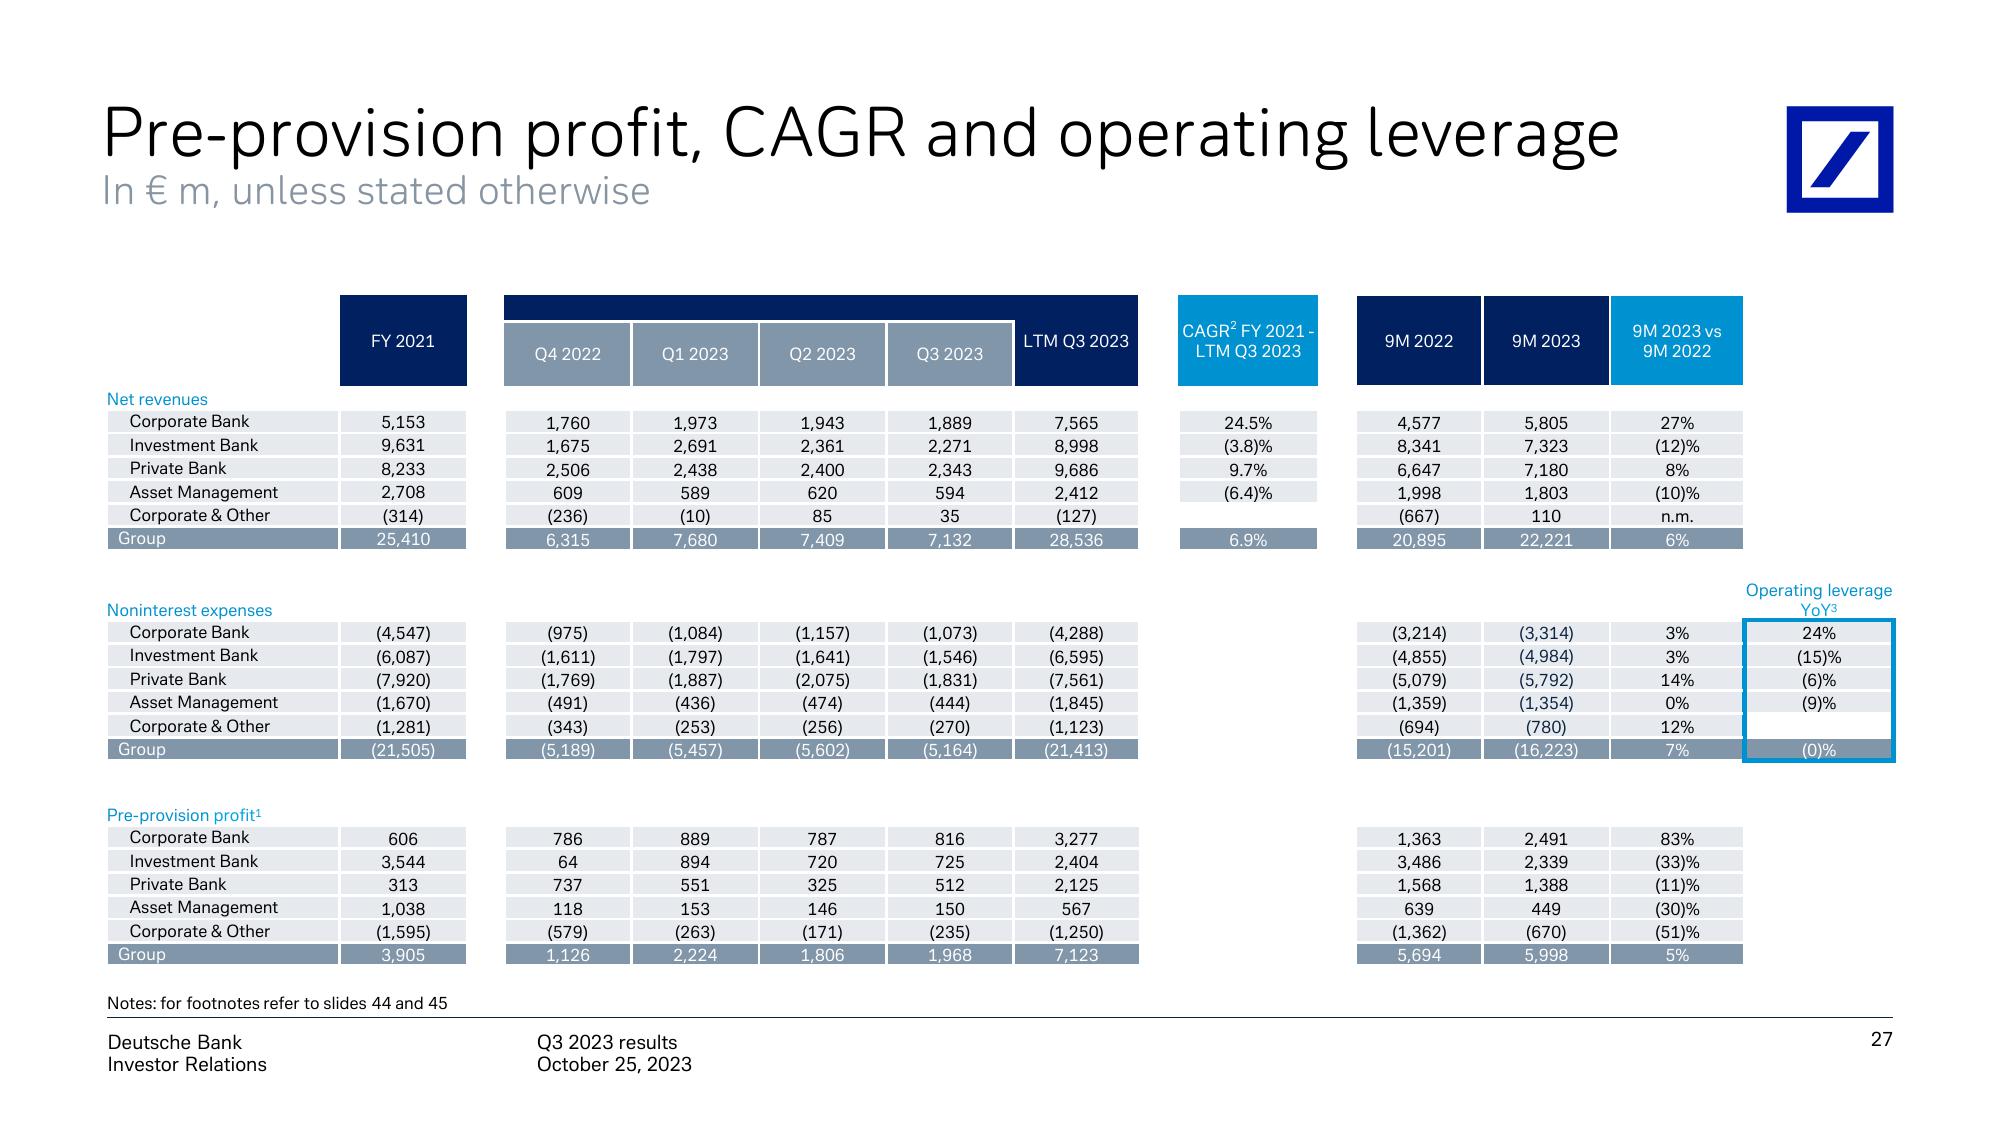
Pre-provision profit, CAGR and operating leverage
In € m, unless stated otherwise
Net revenues
Corporate Bank
Investment Bank
Private Bank
Asset Management
Corporate & Other
Group
Noninterest expenses
Corporate Bank
Investment Bank
Private Bank
Asset Management
Corporate & Other
Group
Pre-provision profit¹
Corporate Bank
Investment Bank
Private Bank
Asset Management
Corporate & Other
Group
FY 2021
5,153
9,631
8,233
2,708
(314)
25,410
(4,547)
(6,087)
(7,920)
(1,670)
(1,281)
(21,505)
606
3,544
313
1,038
(1,595)
3,905
Notes: for footnotes refer to slides 44 and 45
Deutsche Bank
Investor Relations
Q4 2022
1,760
1,675
2,506
609
(236)
6,315
(975)
(1,611)
(1,769)
(491)
(343)
(5,189)
786
64
737
118
(579)
1,126
Q1 2023
1,973
2,691
2,438
589
(10)
7,680
(1,084)
(1,797)
(1,887)
(436)
(253)
(5,457)
889
894
551
153
(263)
2,224
Q3 2023 results
October 25, 2023
Q2 2023
1,943
2,361
2,400
620
85
7,409
(1,157)
(1,641)
(2,075)
(474)
(256)
(5,602)
787
720
325
146
(171)
1,806
Q3 2023
1,889
2,271
2,343
594
35
7,132
(1,073)
(1,546)
(1,831)
(444)
(270)
(5,164)
816
725
512
150
(235)
1,968
LTM Q3 2023
7,565
8,998
9,686
2,412
(127)
28,536
(4,288)
(6,595)
(7,561)
(1,845)
(1,123)
(21,413)
3,277
2,404
2,125
567
(1,250)
7,123
CAGR² FY 2021-
LTM Q3 2023
24.5%
(3.8)%
9.7%
(6.4)%
6.9%
9M 2022
4,577
8,341
6,647
1,998
(667)
20,895
(3,214)
(4,855)
(5,079)
(1,359)
(694)
(15,201)
1,363
3,486
1,568
639
(1,362)
5,694
9M 2023
5,805
7,323
7,180
1,803
110
22,221
(3,314)
(4,984)
(5,792)
(1,354)
(780)
(16,223)
2,491
2,339
1,388
449
(670)
5,998
9M 2023 vs
9M 2022
27%
(12)%
8%
(10)%
n.m.
6%
3%
3%
14%
0%
12%
7%
83%
(33)%
(11)%
(30)%
(51)%
5%
/
Operating leverage
YoY3
24%
(15)%
(6)%
(9)%
(0)%
27View entire presentation