HSBC Results Presentation Deck
Commercial Banking
4021 financial highlights
Revenue
ECL
Costs
PBT
3,144
363
422
ROTE4⁹
Revenue performance, $m
1,461
898
4Q20
3,269
534
448
1,440
$3.4bn
$(0.2)bn
$(1.8)bn
$1.4bn
847
1Q21
10.8%
8%
3,239
451
469
1,460
859
2021
Markets products, Insurance
and Investments and Other
GTRF
8%
4020: $3.1bn
75%
4020: $(0.9) bn
(1)%
4020: $(1.8)bn
GLCM
>100%
4020: $0.5bn
9.5ppt
(FY20: 1.3%)
3,331
450
495
1,501
2%
3,389
372
512
1,567
885
3Q21
Credit and Lending
938
4Q21
Balance sheet, $bn
Customer lending
- 3%
338
4Q20
464
345
Customer accounts
4020
3Q21
9%
488
3Q21
1%
4%
349
4Q21
507
4Q21
Strategy
4021 results
Appendix
4Q21 vs. 4Q20
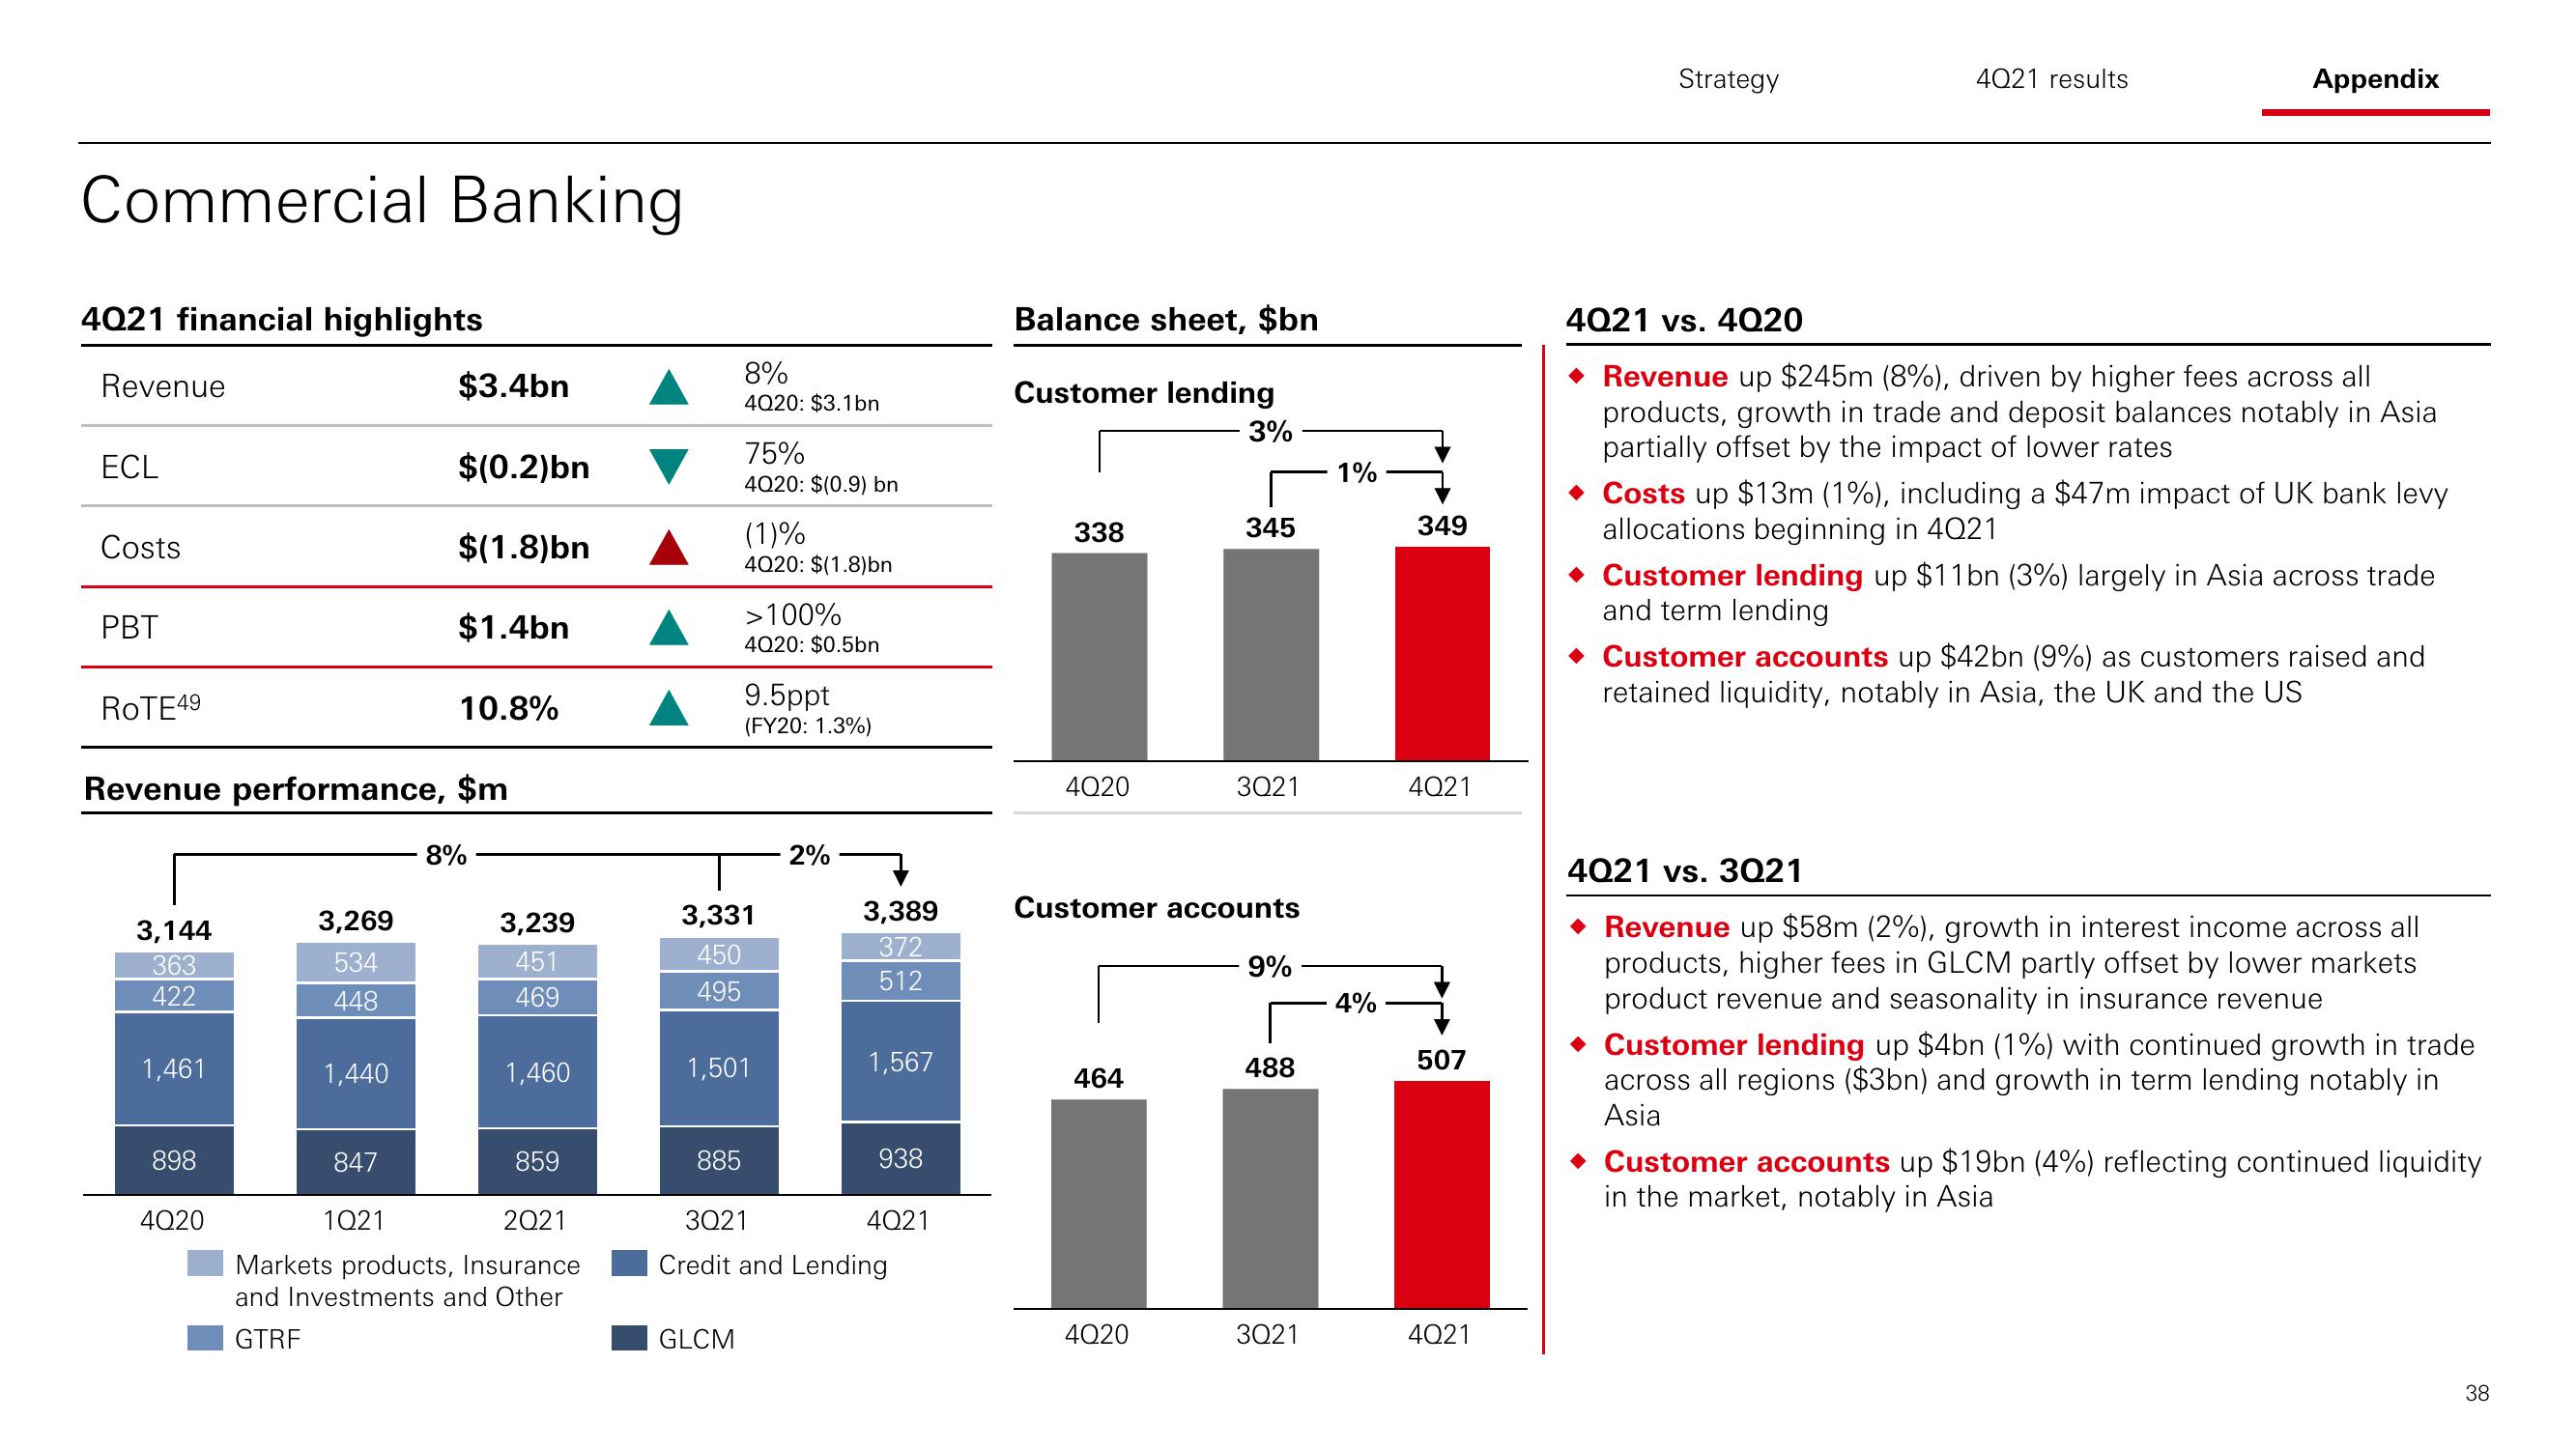
Revenue up $245m (8%), driven by higher fees across all
products, growth in trade and deposit balances notably in Asia
partially offset by the impact of lower rates
◆ Costs up $13m (1%), including a $47m impact of UK bank levy
allocations beginning in 4021
◆ Customer lending up $11bn (3%) largely in Asia across trade
and term lending
Customer accounts up $42bn (9%) as customers raised and
retained liquidity, notably in Asia, the UK and the US
4021 vs.
3Q21
Revenue up $58m (2%), growth in interest income across all
products, higher fees in GLCM partly offset by lower markets
product revenue and seasonality in insurance revenue
◆ Customer lending up $4bn (1%) with continued growth in trade
across all regions ($3bn) and growth in term lending notably in
Asia
Customer accounts up $19bn (4%) reflecting continued liquidity
in the market, notably in Asia
38View entire presentation