Commercial Metals Company Results Presentation Deck
Adjusted EBITDA and
and
CMC
Core
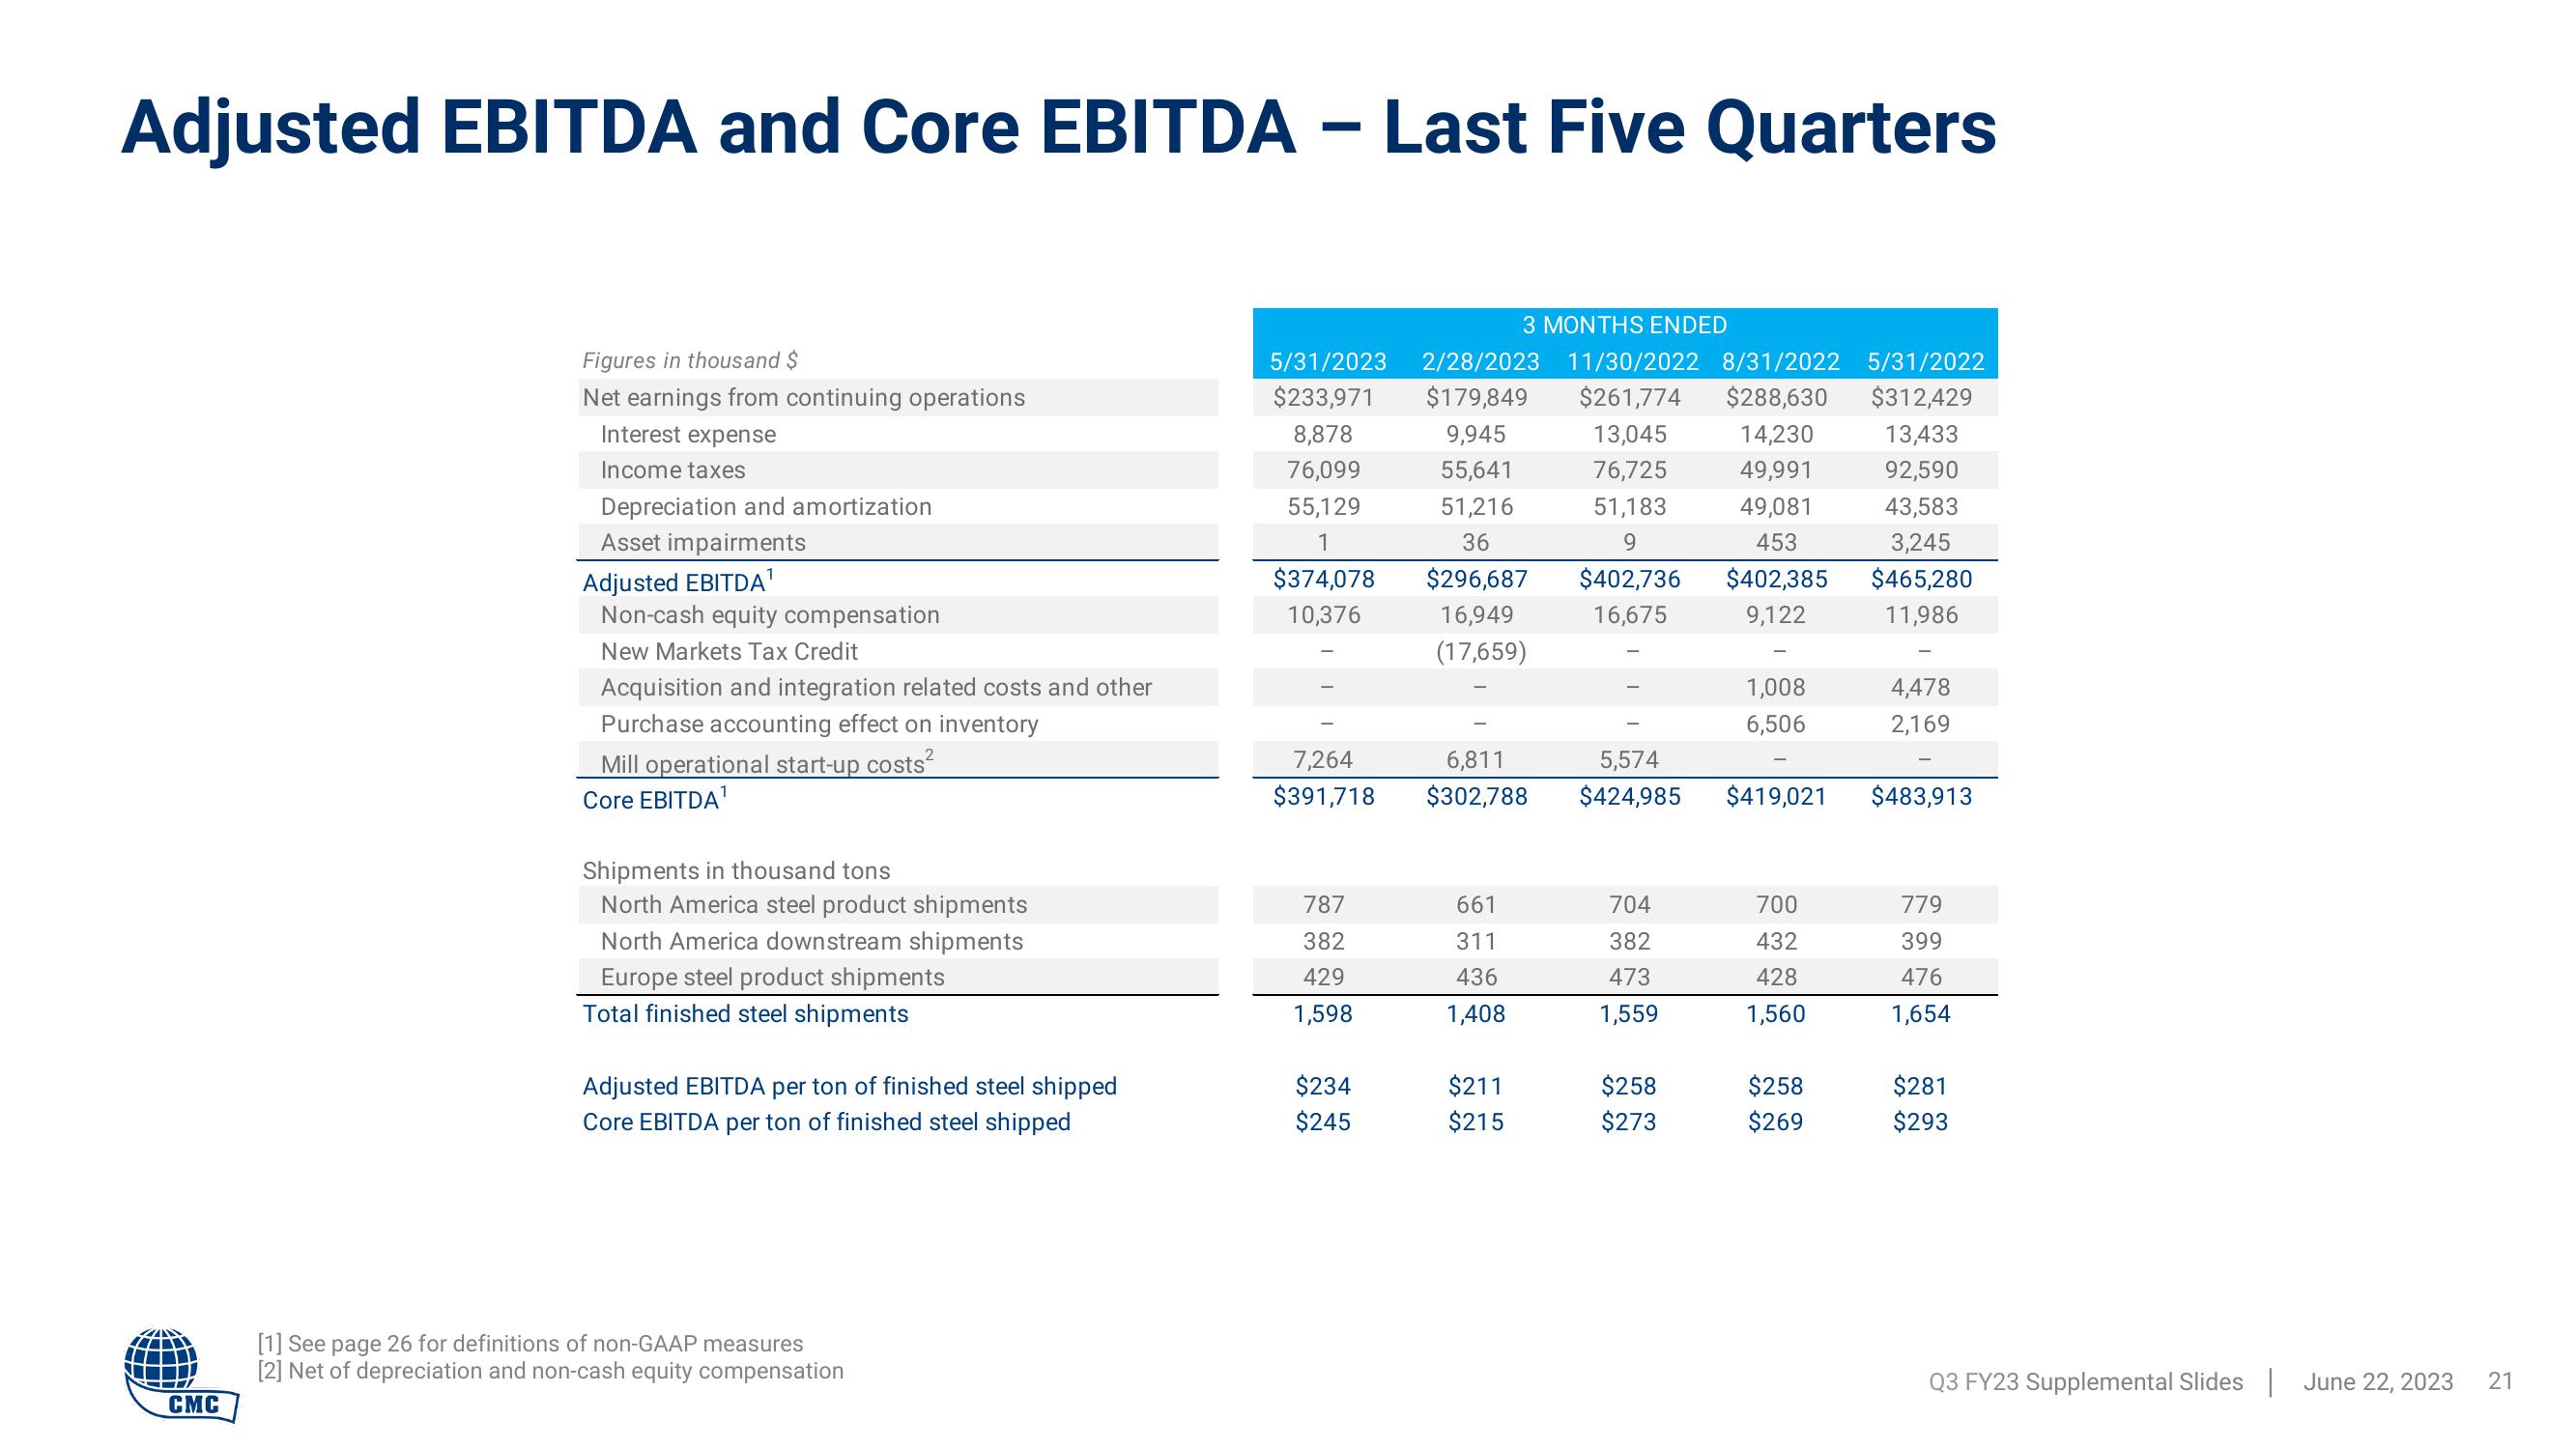
Core EBITDA - Last Five Quarters
EBITDA
Figures in thousand $
Net earnings from continuing operations
Interest expense
Income taxes
Depreciation and amortization
Asset impairments
Adjusted EBITDA¹
Non-cash equity compensation
New Markets Tax Credit
Acquisition and integration related costs and other
Purchase accounting effect on inventory
Mill operational start-up costs²
Core EBITDA¹
Shipments in thousand tons
North America steel product shipments
North America downstream shipments
Europe steel product shipments
Total finished steel shipments
Adjusted EBITDA per ton of finished steel shipped
Core EBITDA per ton of finished steel shipped
[1] See page 26 for definitions of non-GAAP measures
[2] Net of depreciation and non-cash equity compensation
13,433
13,045
76,725
14,230
49,991
92,590
5/31/2023 2/28/2023 11/30/2022 8/31/2022 5/31/2022
$233,971 $179,849 $261,774 $288,630 $312,429
8,878
76,099
55,129
1
$374,078
10,376
51,183
9
$402,736
16,675
49,081
453
$402,385
9,122
787
382
429
1,598
7,264
6,811
$391,718 $302,788
$234
$245
3 MONTHS ENDED
9,945
55,641
51,216
36
$296,687
16,949
(17,659)
661
311
436
1,408
$211
$215
5,574
$424,985 $419,021
704
382
473
1,559
1,008
6,506
$258
$273
700
432
428
1,560
$258
$269
43,583
3,245
$465,280
11,986
4,478
2,169
$483,913
779
399
476
1,654
$281
$293
Q3 FY23 Supplemental Slides June 22, 2023
21View entire presentation