Morgan Stanley Investment Banking Pitch Book
Project Roosevelt
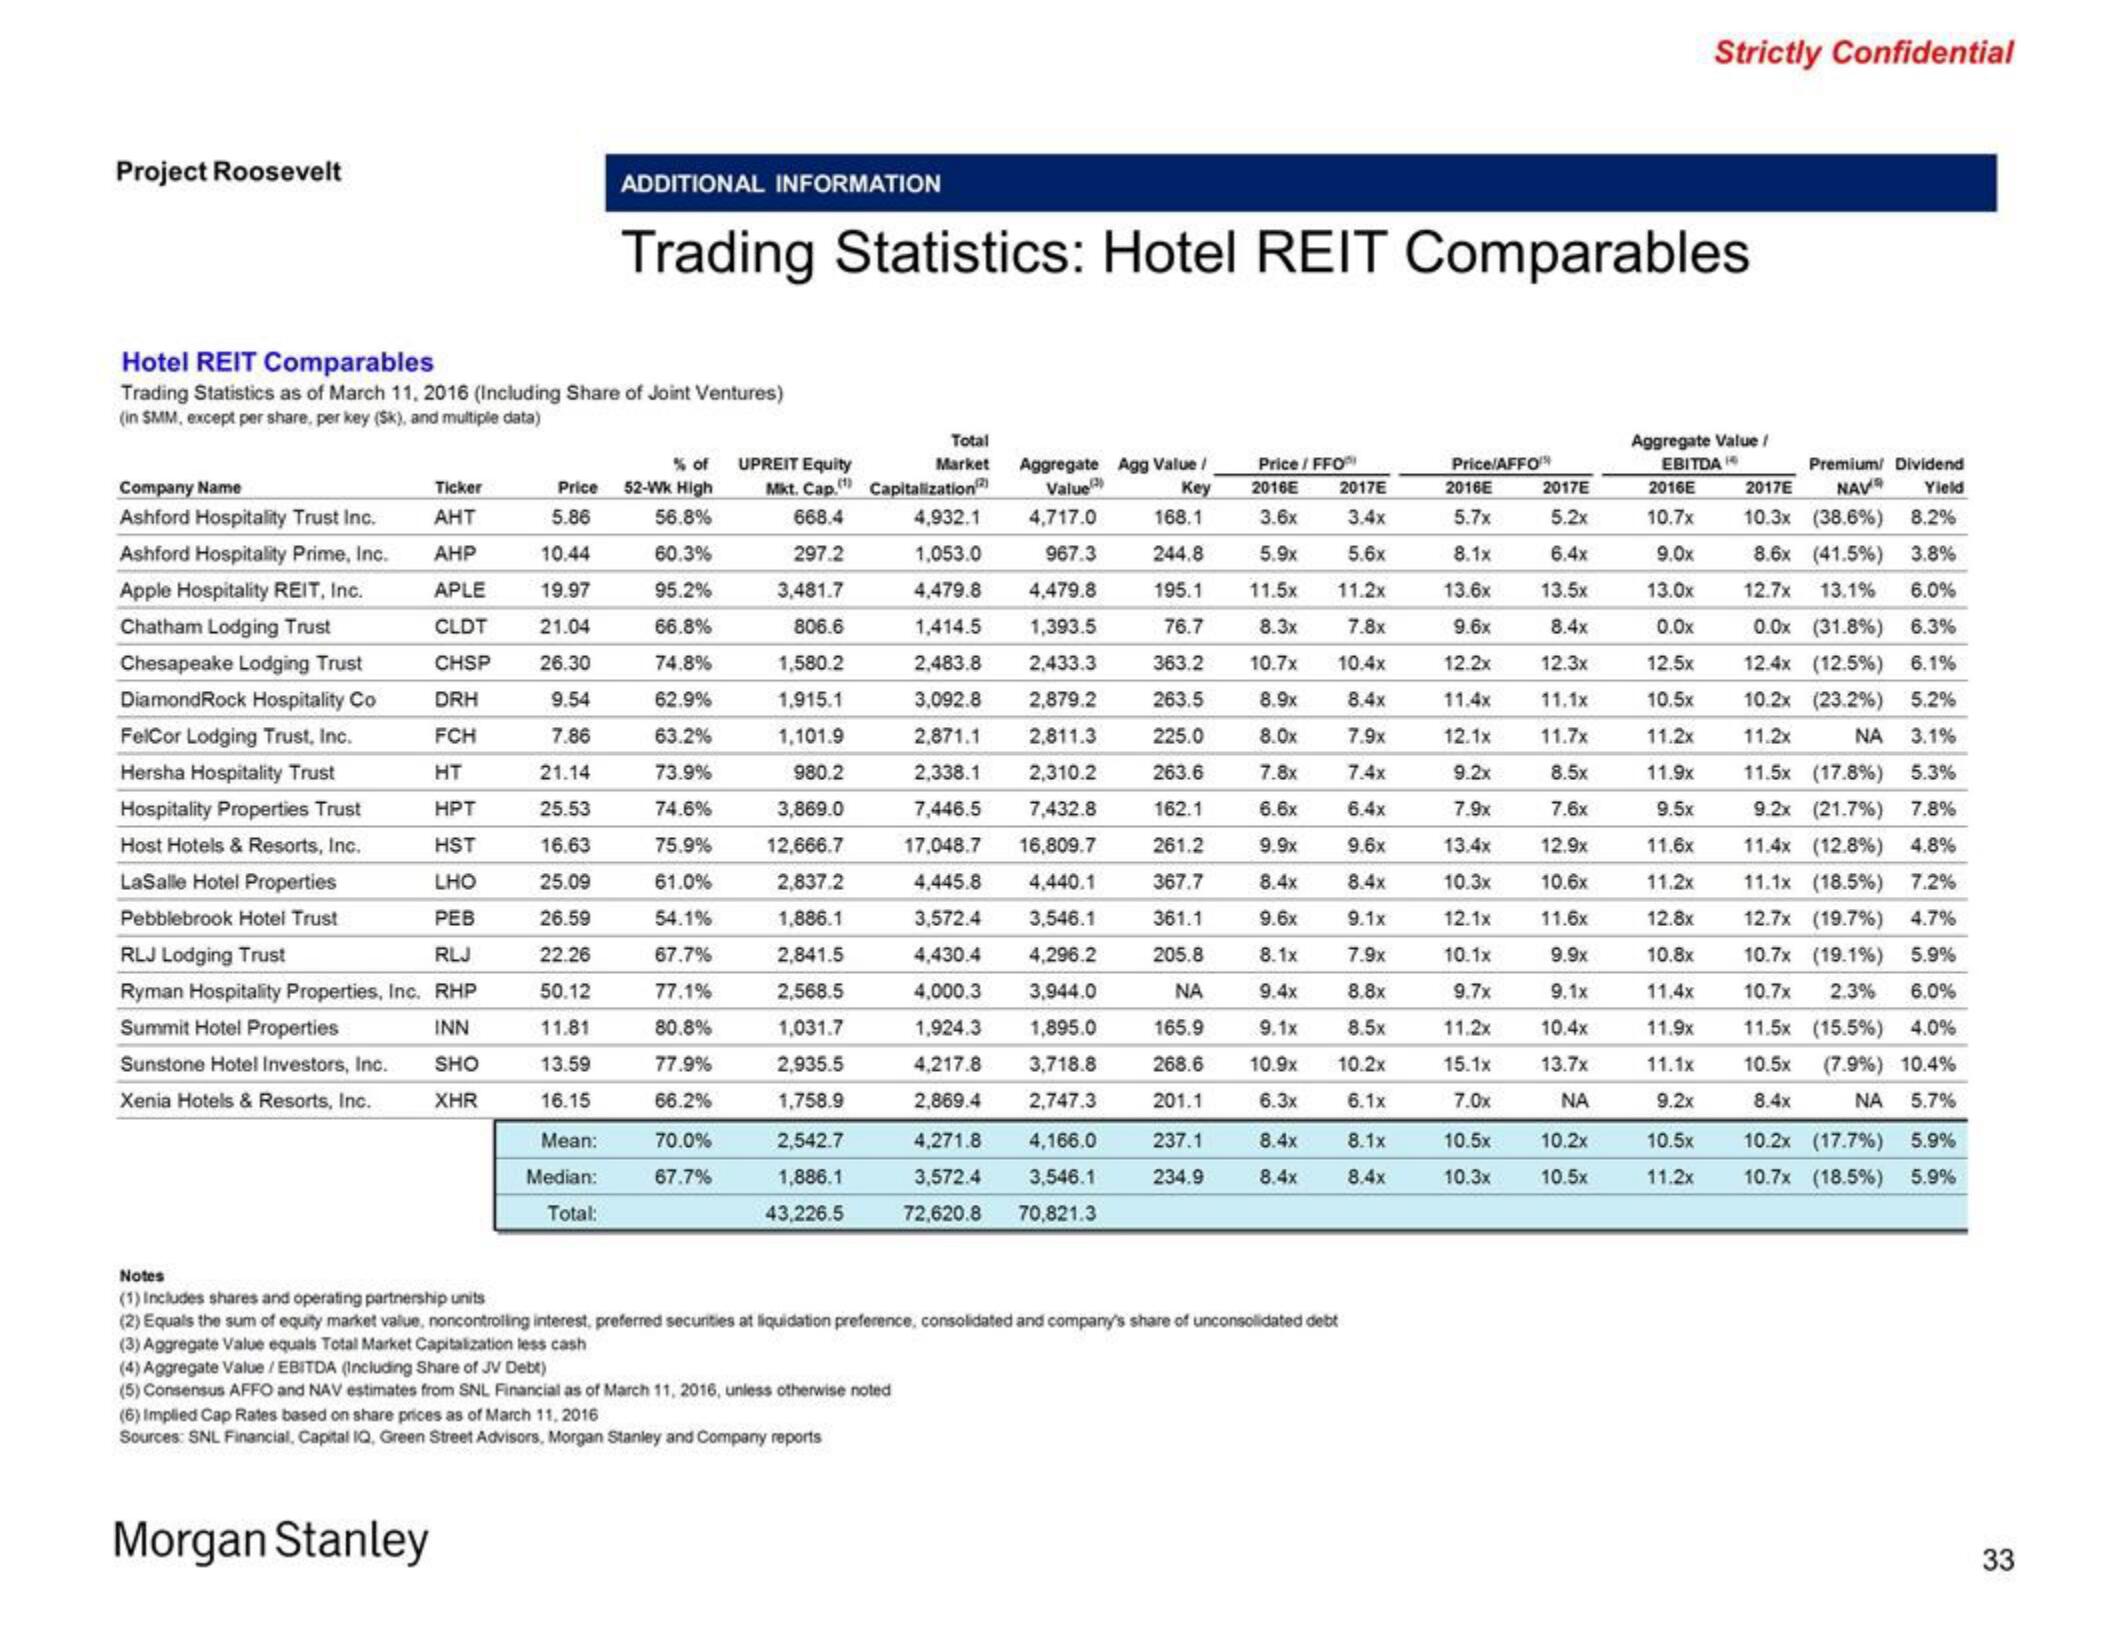
Hotel REIT Comparables
Trading Statistics as of March 11, 2016 (Including Share of Joint Ventures)
(in SMM, except per share, per key (Sk), and multiple data)
Company Name
Ticker
AHT
AHP
APLE
CLDT
CHSP
DRH
Ashford Hospitality Trust Inc.
Ashford Hospitality Prime, Inc.
Apple Hospitality REIT, Inc.
Chatham Lodging Trust
Chesapeake Lodging Trust
DiamondRock Hospitality Co
FelCor Lodging Trust, Inc.
Hersha Hospitality Trust
Hospitality Properties Trust
Host Hotels & Resorts, Inc.
LaSalle Hotel Properties
Pebblebrook Hotel Trust
RLJ Lodging Trust
FCH
HT
HPT
HST
LHO
PEB
RLJ
Ryman Hospitality Properties, Inc. RHP
Summit Hotel Properties
INN
Sunstone Hotel Investors, Inc.
SHO
Xenia Hotels & Resorts, Inc.
XHR
ADDITIONAL INFORMATION
Trading Statistics: Hotel REIT Comparables
% of
Price 52-Wk High
5.86
56.8%
10.44
60.3%
19.97
95.2%
21.04
66.8%
26.30
74.8%
9.54
62.9%
7.86
63.2%
21.14
73.9%
25.53
74.6%
16.63
75.9%
25.09
61.0%
26.59
54.1%
22.26
67.7%
50.12
77.1%
11.81
80.8%
13.59
77.9%
16.15
66.2%
Mean:
Median:
Total:
Morgan Stanley
70.0%
67.7%
UPREIT Equity
Mkt. Cap.
668.4
297.2
3,481.7
806.6
1,580.2
1,915.1
1,101.9
980.2
3,869.0
12,666.7
2,837.2
1,886.1
2,841.5
2,568.5
1,031.7
2,935.5
1,758.9
2,542.7
1,886.1
43,226.5
Total
Capitalization
4,932.1
1,053.0
Market Aggregate Agg Value /
Value
4,717.0
967.3
4,479.8
Key
168.1
244.8
4,479.8
195.1
1,414.5
1,393.5
76.7
2,483.8
2,433.3
363.2
3,092.8
2,879.2
263.5
2,871.1
2,811.3
225.0
263.6
162.1
2,338.1 2,310.2
7,446.5 7,432.8
17,048.7 16,809.7
4,445.8
261.2
4,440.1
367.7
3,572.4
3,546.1
361.1
4,430.4
4,296.2
205.8
4,000.3
3,944.0
ΝΑ
165.9
1,924.3
1,895.0
4,217.8
3,718.8
268.6
2,869.4
2,747.3
201.1
(4) Aggregate Value / EBITDA (Including Share of JV Debt)
(5) Consensus AFFO and NAV estimates from SNL Financial as of March 11, 2016, unless otherwise noted
(6) Implied Cap Rates based on share prices as of March 11, 2016
Sources: SNL Financial, Capital IQ, Green Street Advisors, Morgan Stanley and Company reports
4,271.8
4,166.0
3,572.4 3,546.1
72,620.8
70,821.3
237.1
234.9
Notes
(1) Includes shares and operating partnership units
(2) Equals the sum of equity market value, noncontrolling interest, preferred securities at liquidation preference, consolidated and company's share of unconsolidated debt
(3) Aggregate Value equals Total Market Capitalization less cash
2017E
3.4x
Price / FFOP
2016E
3.6x
5.9x
11.5x
8.3x
10.7x
8.9x
5.6x
11.2x
7.8x
10.4x
8.4x
8.0x
7.9x
7.8x
7.4x
6.6x
6.4x
9.9x
9.6x
8.4x
8.4x
9.6x
9.1x
8.1x
7.9x
9.4x
8.8x
9.1x
8.5x
10.9x 10.2x
6.3x
6.1x
8.4x
8.1x
8.4x 8.4x
Price/AFFO
2016E
5.7x
2017E
5.2x
8.1x 6.4x
13.6x 13,5x
8.4x
12.3x
9.6x
12.2x
11.4x
11.1x
12.1x
11.7x
9.2x
8.5x
7.9x
7.6x
12.9x
10.6x
11.6x
9.9x
9.1x
10.4x
13.7x
ΝΑ
13.4x
10.3x
12.1x
10.1x
9.7x
11.2x
15.1x
7.0x
10.5x
10.3x
10.2x
10.5×
Strictly Confidential
Aggregate Value /
EBITDA
2016E
10.7x
9.0x
13.0x
0.0x
12.5x
10.5x
11.2x
11.9x
9.5x
11.6x
11.2x
12.8x
10.8x
11.4x
11.9x
11.1x
9.2x
10.5×
11.2x
Premium/ Dividend
NAV Yield
8.2%
2017E
10.3x (38.6%)
8.6x (41.5 %) 3.8%
12.7x 13.1% 6.0%
0.0x (31.8%) 6.3%
12.4x (12.5%) 6.1%
10.2x (23.2%) 5.2%
11.2x
NA 3.1%
11.5x (17.8%) 5.3%
9.2x (21.7%) 7.8%
4.8%
11.4x (12.8%)
11.1x (18.5%) 7.2%
12.7x (19.7%) 4.7%
5.9%
10.7x 2.3% 6.0%
10.7x (19.1%)
115x (15.5%) 4.0%
10.5× (7.9%) 10.4%
8.4x
ΝΑ 5.7%
10.2x (17.7%) 5.9%
10.7x (18.5%) 5.9%
33View entire presentation