DraftKings Results Presentation Deck
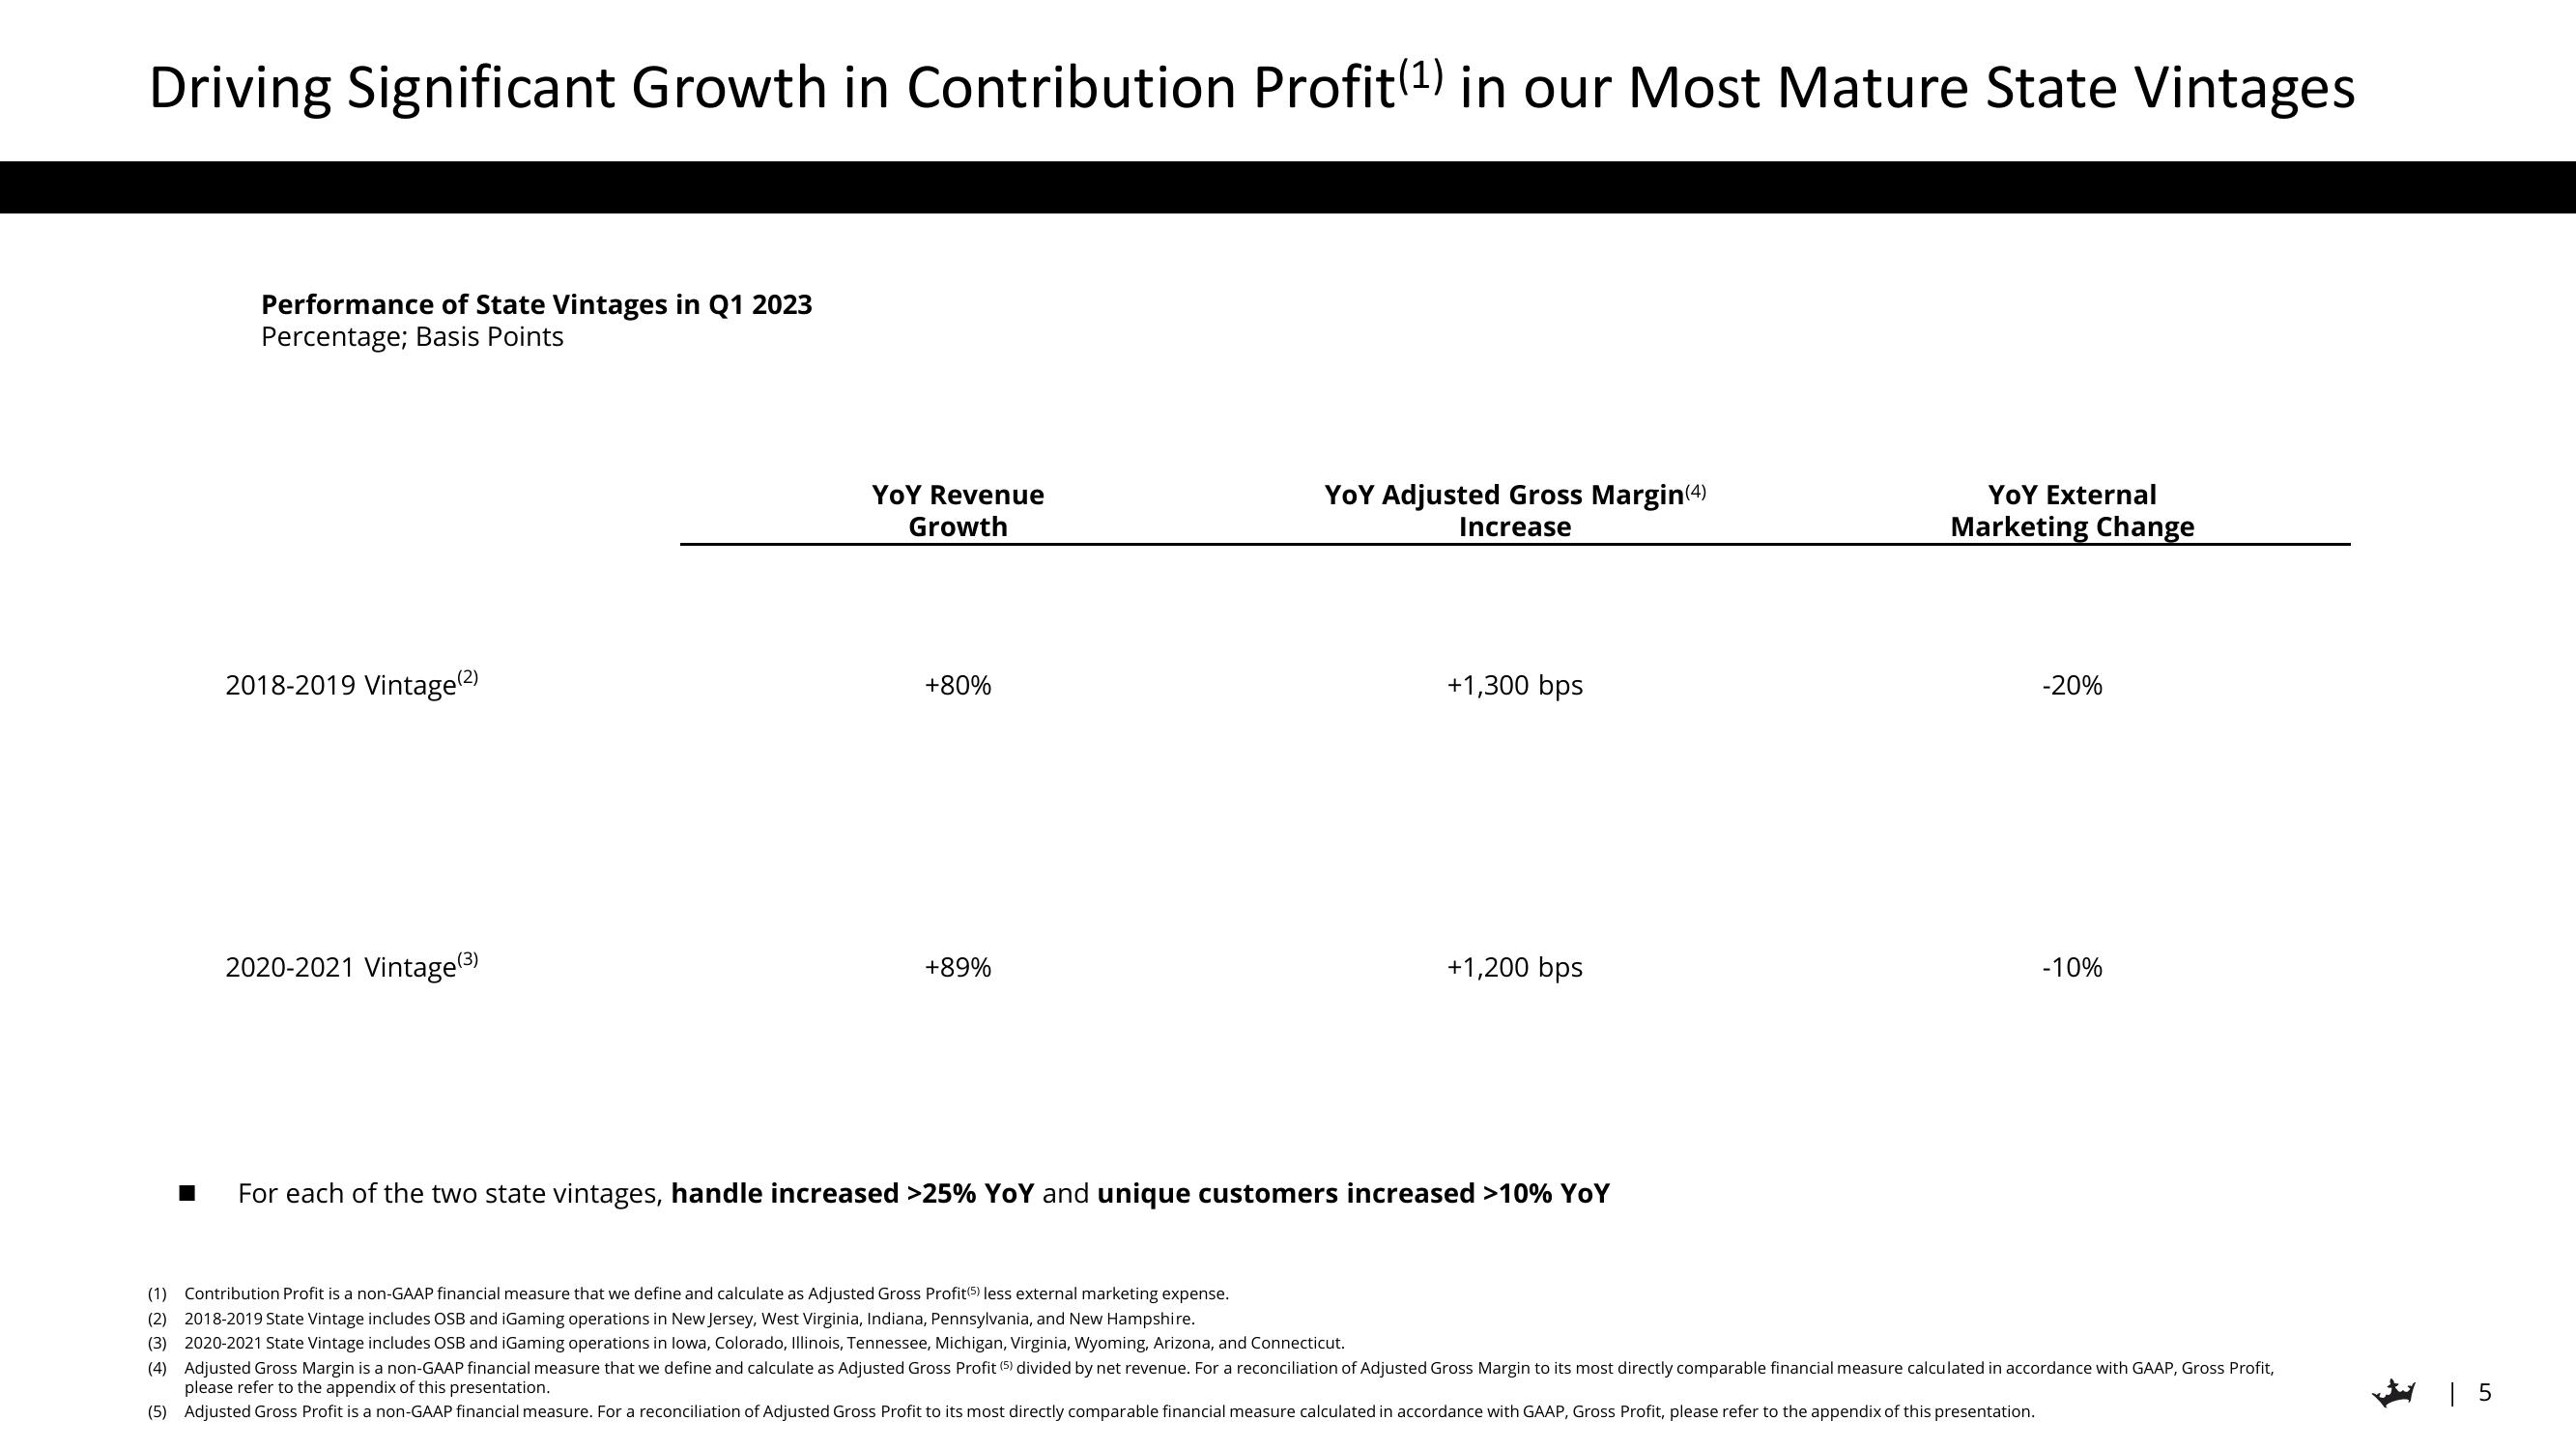
Driving Significant Growth in Contribution Profit (¹) in our Most Mature State Vintages
■
Performance of State Vintages in Q1 2023
Percentage; Basis Points
2018-2019 Vintage (²)
2020-2021 Vintage (³)
YOY Revenue
Growth
+80%
+89%
YOY Adjusted Gross Margin(4)
Increase
+1,300 bps
(1) Contribution Profit is a non-GAAP financial measure that we define and calculate as Adjusted Gross Profit (5) less external marketing expense.
(2) 2018-2019 State Vintage includes OSB and iGaming operations in New Jersey, West Virginia, Indiana, Pennsylvania, and New Hampshire.
(3) 2020-2021 State Vintage includes OSB and iGaming operations in lowa, Colorado, Illinois, Tennessee, Michigan, Virginia, Wyoming, Arizona, and Connecticut.
+1,200 bps
For each of the two state vintages, handle increased >25% YoY and unique customers increased >10% YoY
YOY External
Marketing Change
-20%
-10%
(4) Adjusted Gross Margin is a non-GAAP financial measure that we define and calculate as Adjusted Gross Profit (5) divided by net revenue. For a reconciliation of Adjusted Gross Margin to its most directly comparable financial measure calculated in accordance with GAAP, Gross Profit,
please refer to the appendix of this presentation.
(5) Adjusted Gross Profit is a non-GAAP financial measure. For a reconciliation of Adjusted Gross Profit to its most directly comparable financial measure calculated in accordance with GAAP, Gross Profit, please refer to the appendix of this presentation.
| 5View entire presentation