Nexters Results Presentation Deck
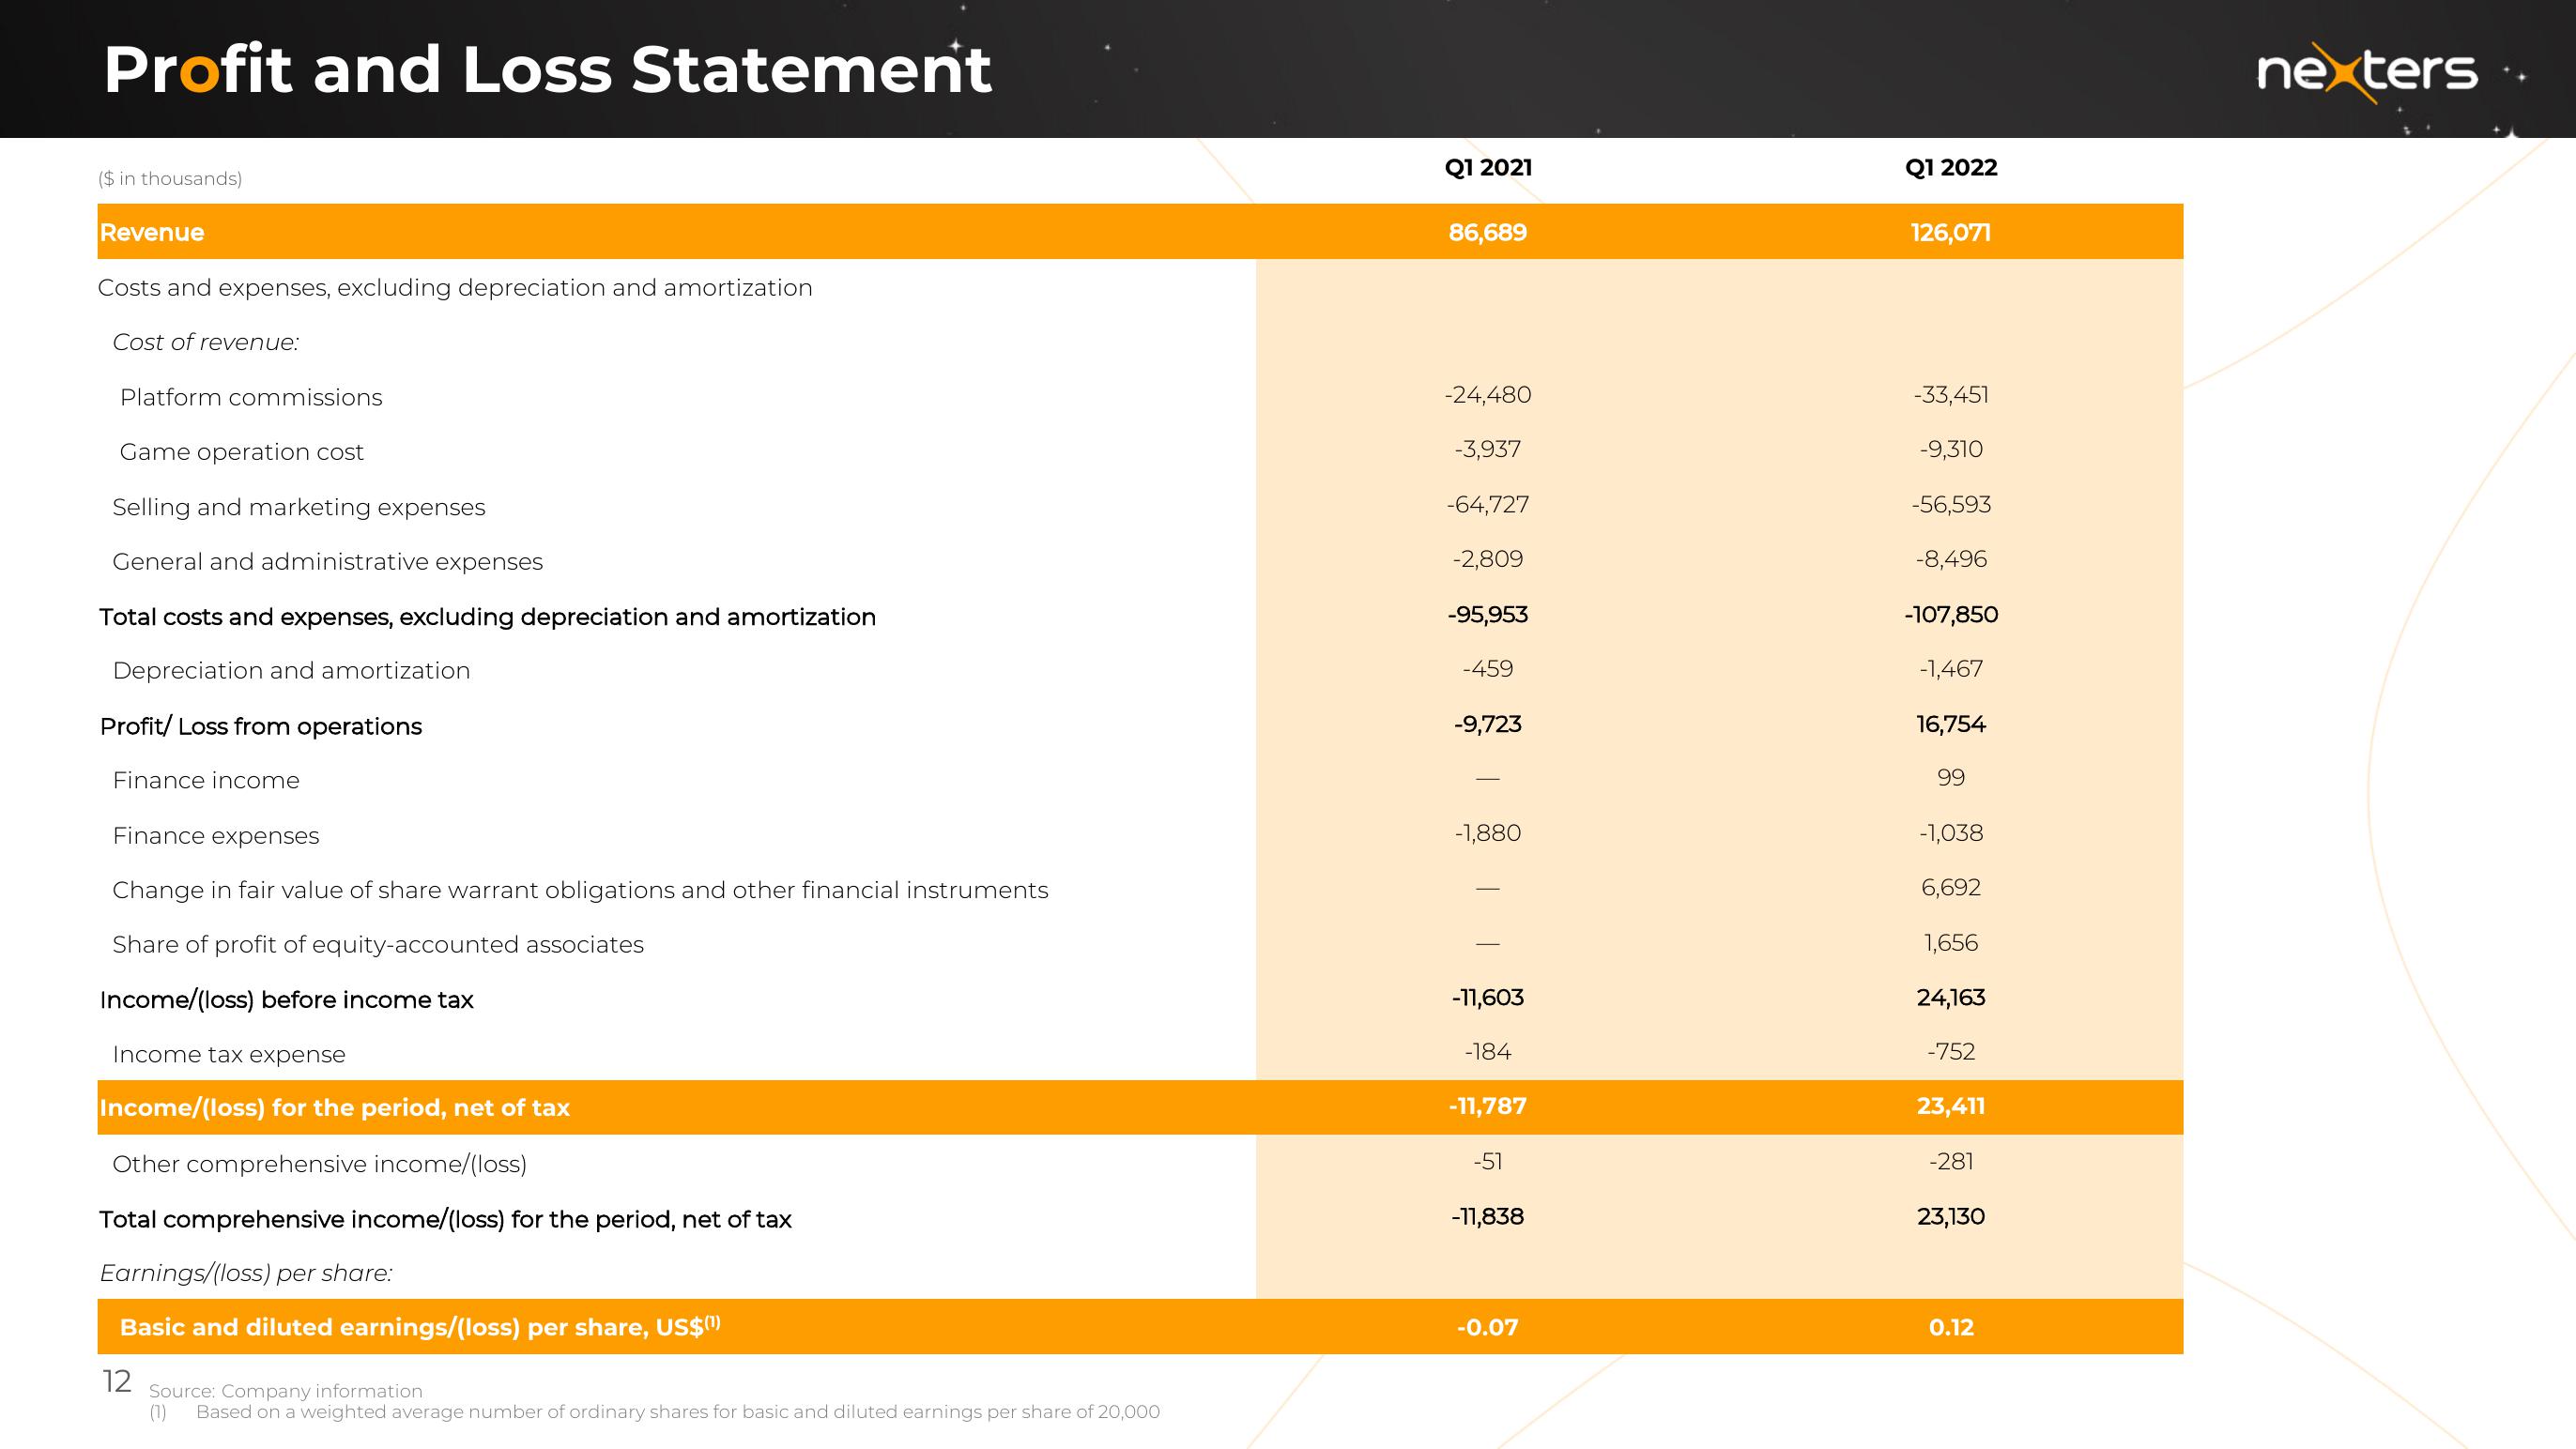
Profit and Loss Statement
($ in thousands)
Revenue
Costs and expenses, excluding depreciation and amortization
Cost of revenue:
Platform commissions
Game operation cost
Selling and marketing expenses
General and administrative expenses
Total costs and expenses, excluding depreciation and amortization
Depreciation and amortization
Profit/ Loss from operations
Finance income
Finance expenses
Change in fair value of share warrant obligations and other financial instruments
Share of profit of equity-accounted associates
Income/(loss) before income tax
Income tax expense
Income/(loss) for the period, net of tax
Other comprehensive income/(loss)
Total comprehensive income/(loss) for the period, net of tax
Earnings/(loss) per share:
Basic and diluted earnings/(loss) per share, US$("¹)
12 Source: Company information
(1) Based on a weighted average number of ordinary shares for basic and diluted earnings per share of 20,000
Q1 2021
86,689
-24,480
-3,937
-64,727
-2,809
-95,953
-459
-9,723
-1,880
-11,603
-184
-11,787
-51
-11,838
-0.07
Q1 2022
126,071
-33,451
-9,310
-56,593
-8,496
-107,850
-1,467
16,754
99
-1,038
6,692
1,656
24,163
-752
23,411
-281
23,130
0.12
nextersView entire presentation