AgroFresh SPAC Presentation Deck
Business Overview
AgroFresh
at a
Glance
($ in millions)
% Margin
Pro Forma
EBITDA(1)(2)
$56
47%
• Global solutions provider
focused on freshness of
produce
2012
●
Unique, sustainable business
model - High touch; asset light
Robust Financial Performance
Proven track record of
innovation and growth
Highly respected through the
value chain
Strong position today;
Well positioned for future growth
$77
52%
2013
$95
56%
2014
14%
By Geography
8%
38%
Geographic Reach
2014 Revenue Breakdown
By Crop
40%
North America
EMEA
Geographic Presence
Global Headquarters
R&D Center
Sales Office
● Service or Repacking Center
■Latin America
■Asia Pacific
12%
88%
(1)
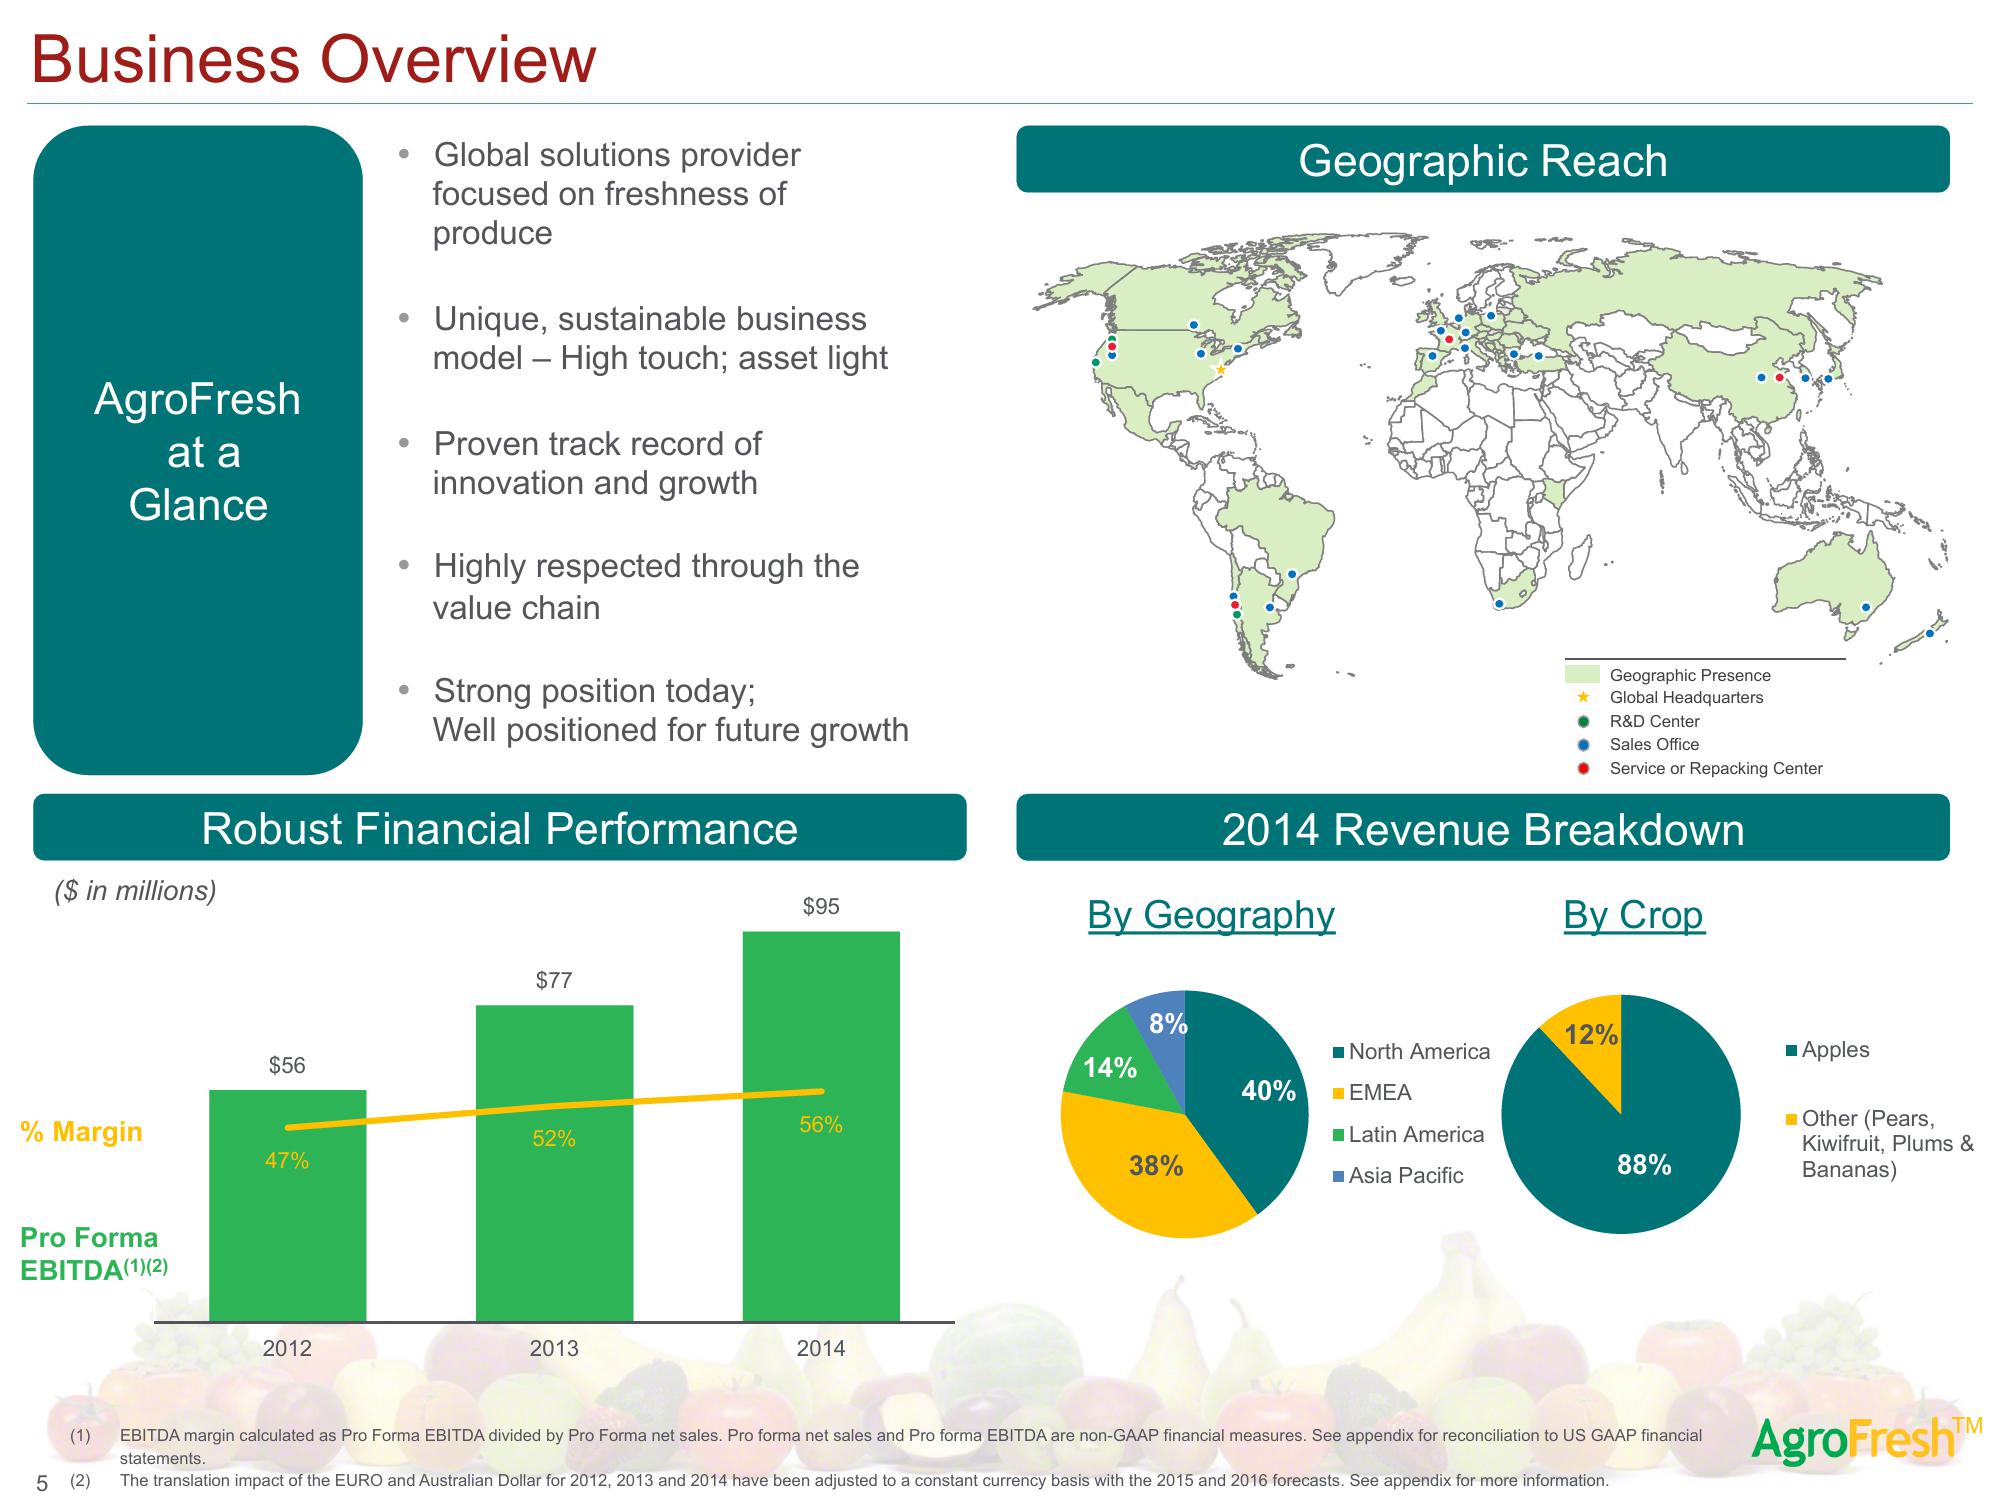
EBITDA margin calculated as Pro Forma EBITDA divided by Pro Forma net sales. Pro forma net sales and Pro forma EBITDA are non-GAAP financial measures. See appendix for reconciliation to US GAAP financial
statements.
5 (2) The translation impact of the EURO and Australian Dollar for 2012, 2013 and 2014 have been adjusted to a constant currency basis with the 2015 and 2016 forecasts. See appendix for more information.
■ Apples
Other (Pears,
Kiwifruit, Plums &
Bananas)
AgroFresh™MView entire presentation