Amplitude Results Presentation Deck
(8
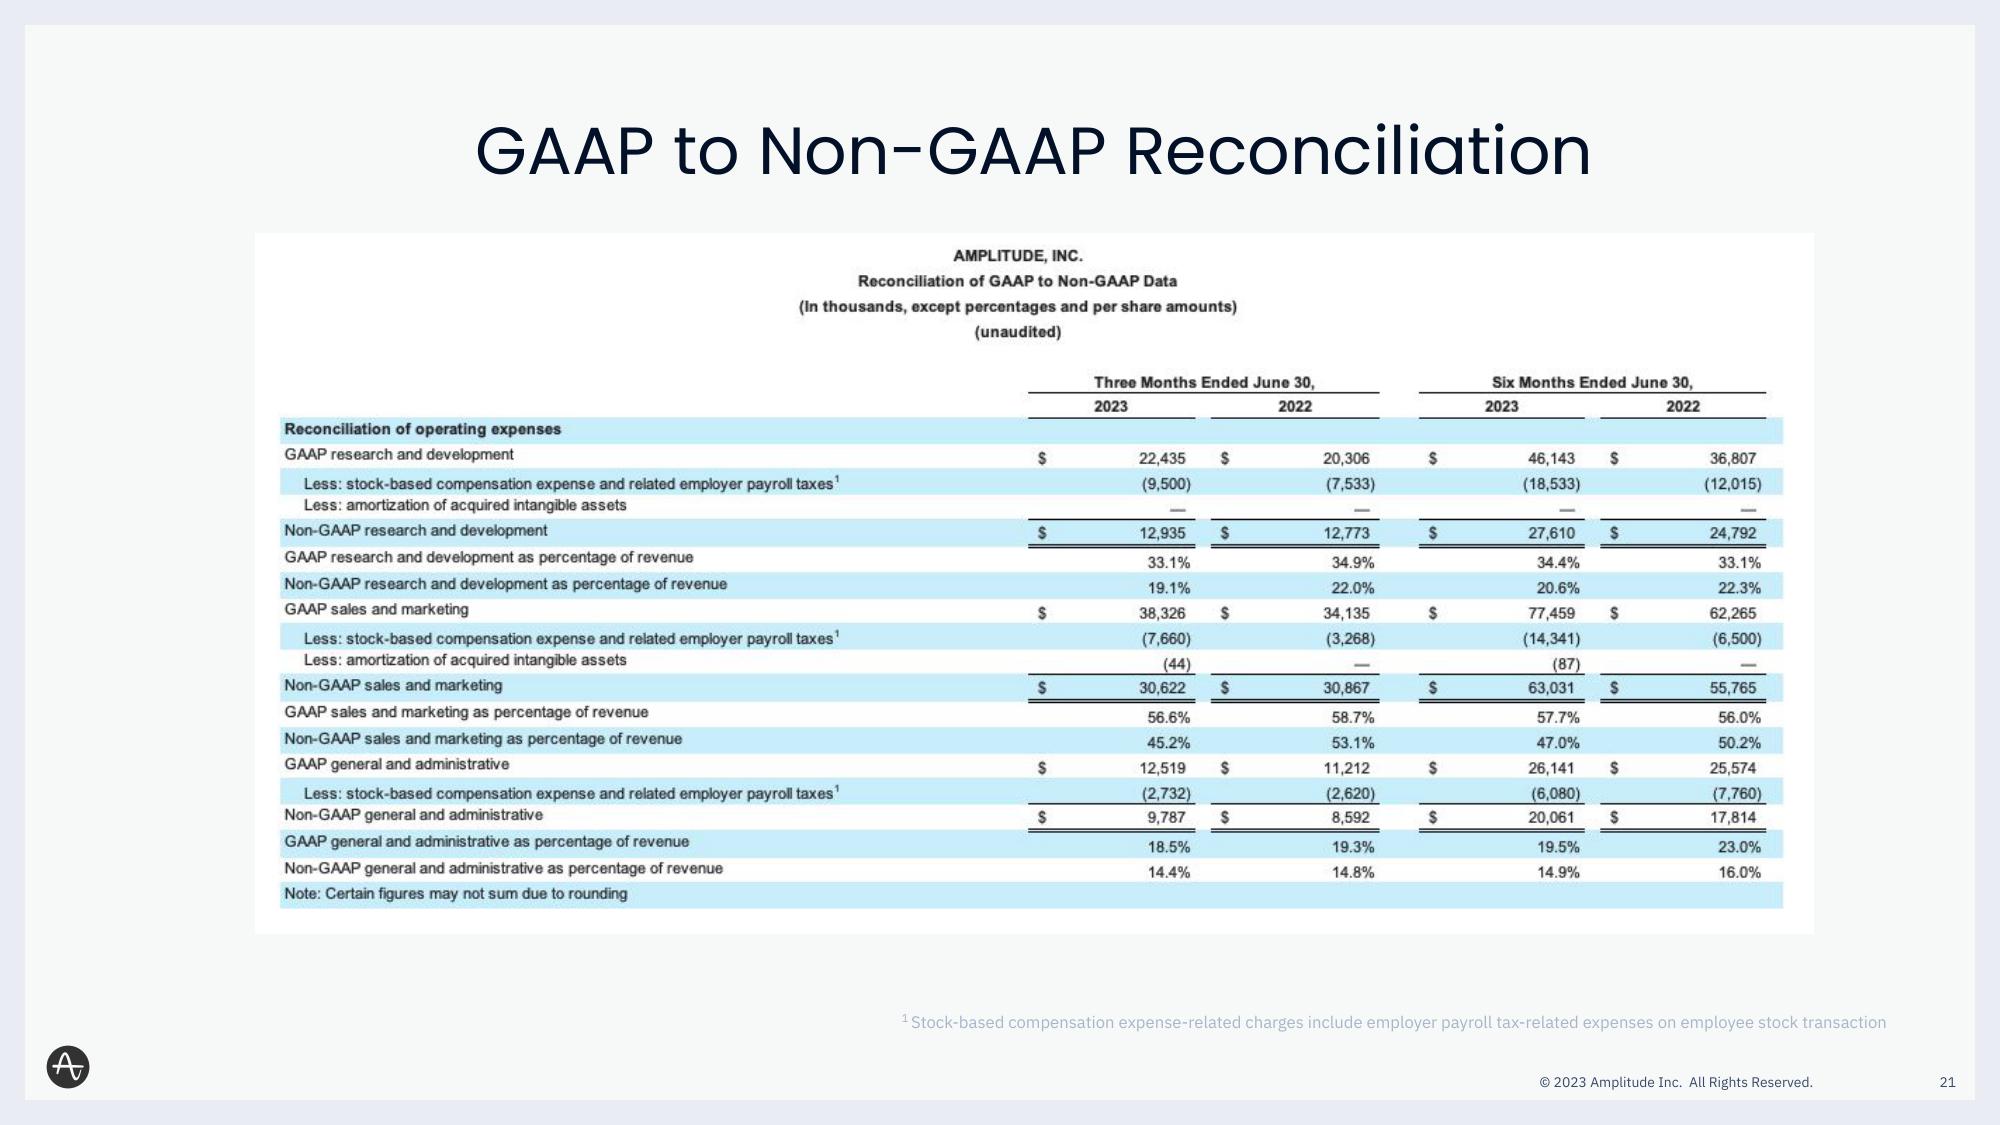
GAAP to Non-GAAP Reconciliation
Reconciliation of operating expenses
GAAP research and development
Less: stock-based compensation expense and related employer payroll taxes¹
Less: amortization of acquired intangible assets
Non-GAAP research and development
GAAP research and development as percentage of revenue
Non-GAAP research and development as percentage of revenue
GAAP sales and marketing
AMPLITUDE, INC.
Reconciliation of GAAP to Non-GAAP Data
(In thousands, except percentages and per share amounts)
(unaudited)
Less: stock-based compensation expense and related employer payroll taxes¹
Less: amortization of acquired intangible assets
Non-GAAP sales and marketing
GAAP sales and marketing as percentage of revenue
Non-GAAP sales and marketing as percentage of revenue
GAAP general and administrative
Less: stock-based compensation expense and related employer payroll taxes¹
Non-GAAP general and administrative
GAAP general and administrative as percentage of revenue
Non-GAAP general and administrative as percentage of revenue
Note: Certain figures may not sum due to rounding
$
$
$
$
$
$
Three Months Ended June 30,
2023
2022
22,435
(9,500)
12,935
33.1%
19.1%
38,326
(7,660)
(44)
30,622
56.6%
45.2%
12,519
(2,732)
9,787
18.5%
14.4%
$
$
$
$
20,306
(7,533)
12,773
34.9%
22.0%
34,135
(3,268)
30,867
58.7%
53.1%
11,212
(2,620)
8,592
19.3%
14.8%
$
S
$
S
$
Six Months Ended June 30,
2023
2022
46,143
(18,533)
$
27,610 $
34.4%
20.6%
77,459
(14,341)
(87)
63,031 S
57.7%
47.0%
26,141
(6,080)
20,061
19.5%
14.9%
S
$
$
36,807
(12,015)
24,792
33.1%
22.3%
62,265
(6,500)
55,765
56.0%
50.2%
25,574
(7,760)
17,814
23.0%
16.0%
1 Stock-based compensation expense-related charges include employer payroll tax-related expenses on employee stock transaction
© 2023 Amplitude Inc. All Rights Reserved.
21View entire presentation