Matson Results Presentation Deck
5
Hawaii Service - Current Business Trends
Unemployment Rate
Select Hawaii Economic Indicators
10.0%
9.0%
8.0%
7.0%
6.0%
5.0%
4.0%
3.0%
2.0%
1.0%
0.0%
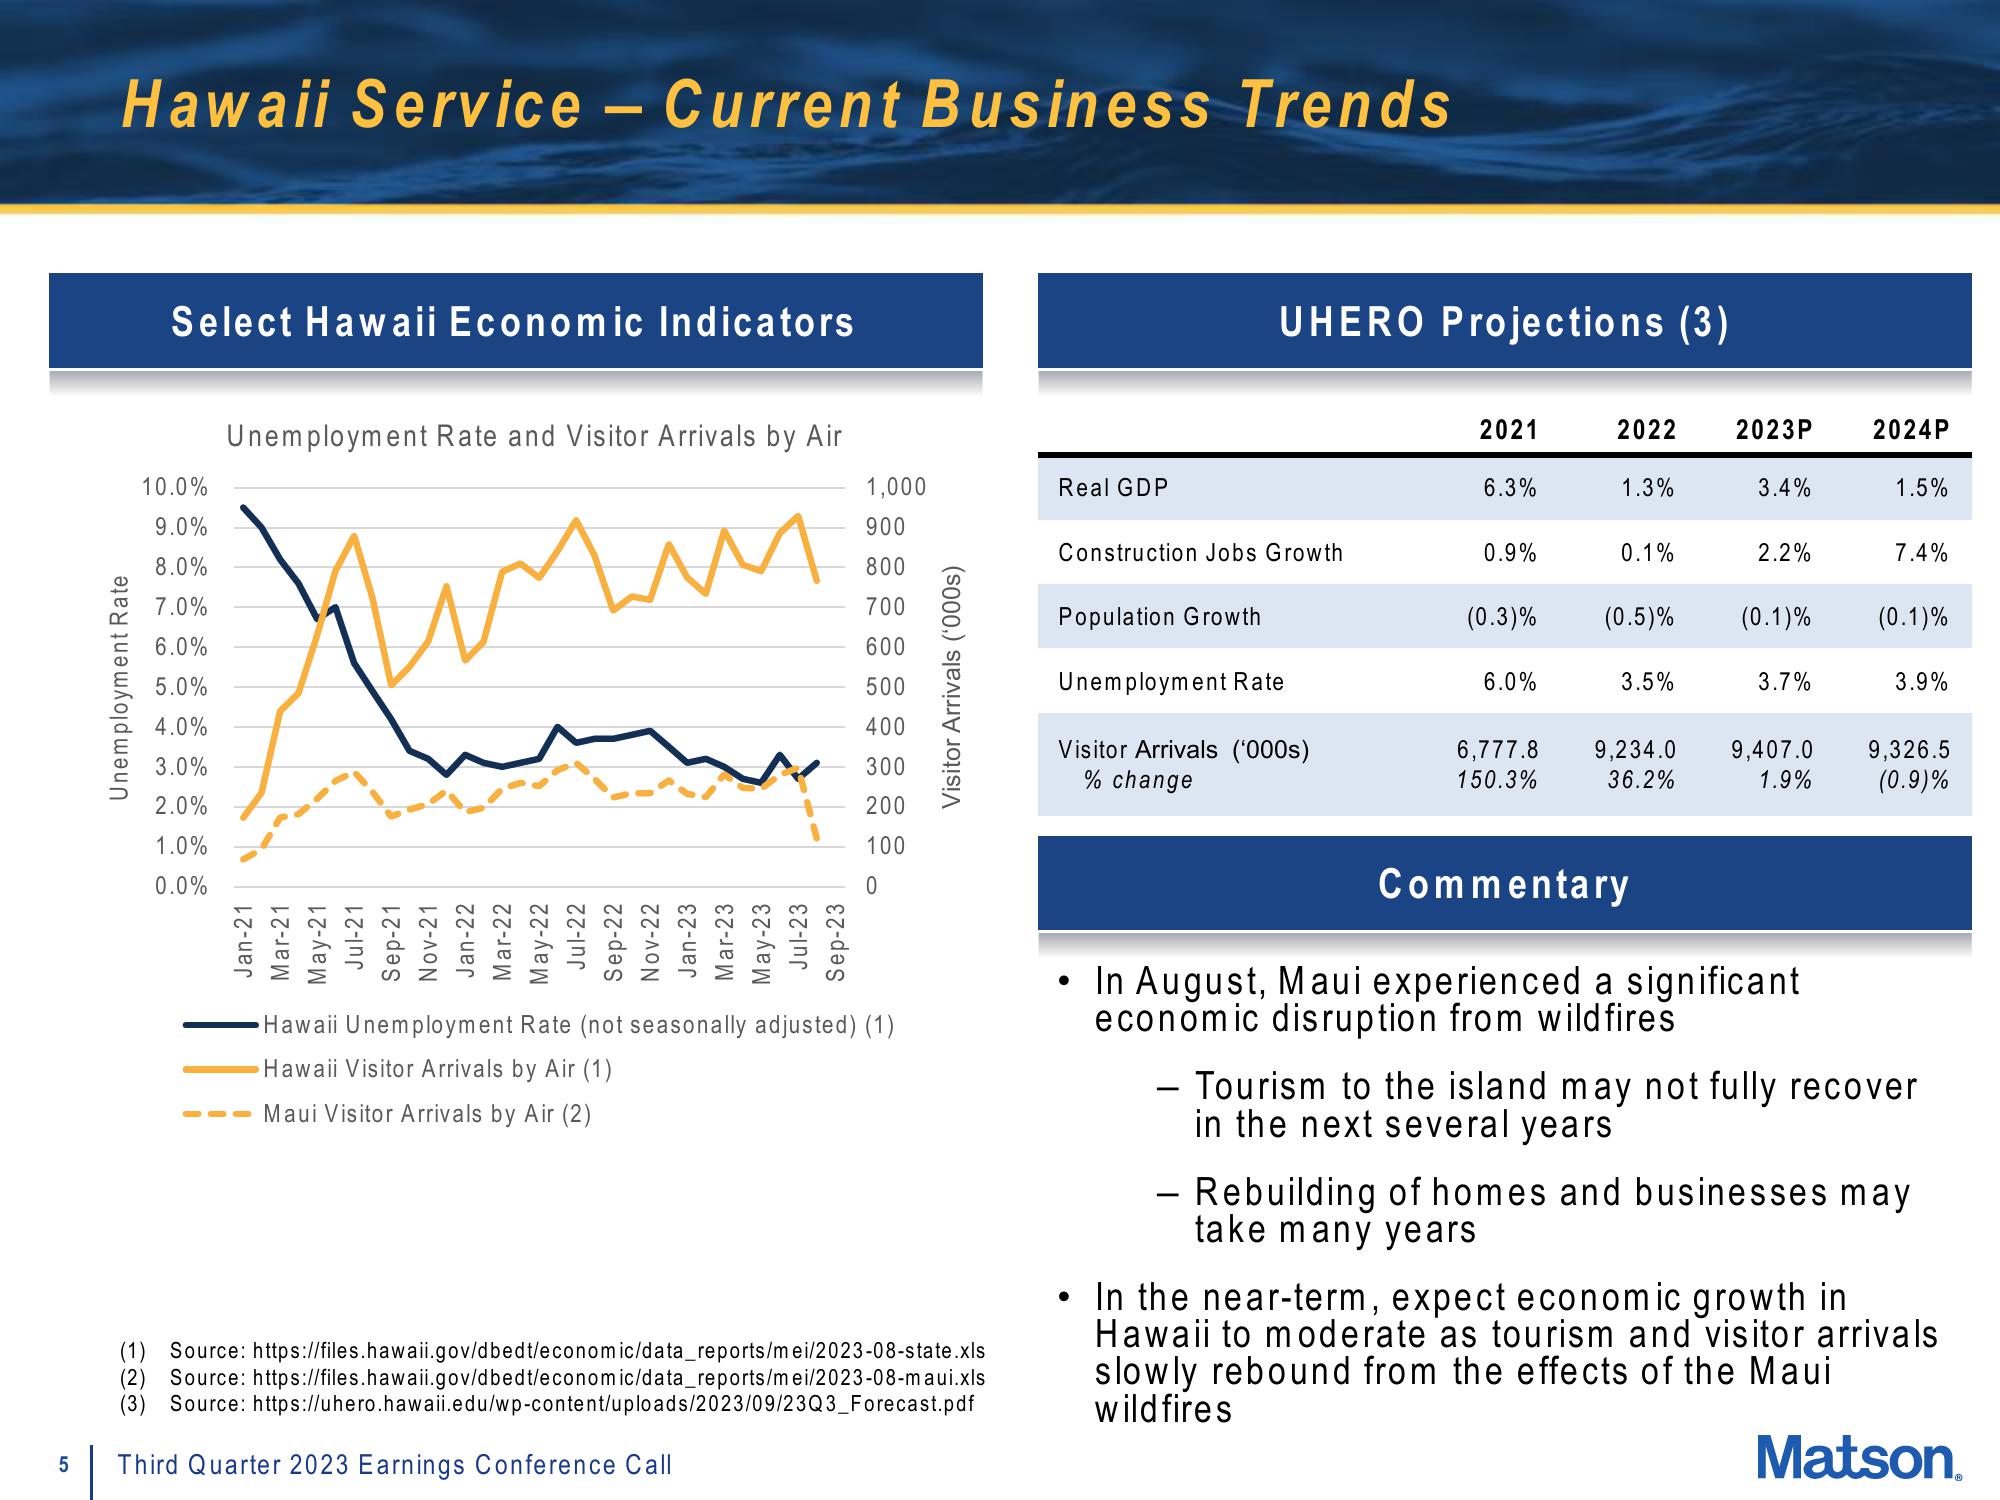
Unemployment Rate and Visitor Arrivals by Air
W
или
Jan-21
Mar-21
May-21
Jul-21
Sep-21
Nov-21
Jan-22
Mar-22
May-22
Jul-22
Sep-22
Nov-22
Jan-23
Mar-23
May-23
Jul-23
Sep-23
Hawaii
Hawaii Visitor Arrivals by Air (1)
Maui Visitor Arrivals by Air (2)
1,000
900
800
700
600
500
400
300
200
100
0
Unemployment Rate (not seasonally adjusted) (1)
Visitor Arrivals ('000s)
(1) Source: https://files.hawaii.gov/dbedt/economic/data_reports/mei/2023-08-state.xls
(2) Source: https://files.hawaii.gov/d bedt/economic/data_reports/mei/2023-08-maui.xls
(3) Source:
Third Quarter 2023 Earnings Conference Call
https://uhero.hawaii.edu/wp-content/uploads/2023/09/23Q3_Forecast.pdf
Real GDP
Construction Jobs Growth
Population Growth
UHERO Projections (3)
Unemployment Rate
Visitor Arrivals ('000s)
% change
●
2021
6.3%
0.9%
(0.3)%
6.0%
6,777.8
150.3%
2022
1.3%
0.1%
(0.5)%
3.5%
9,234.0
36.2%
2023P
3.4%
2.2%
(0.1)%
3.7%
9,407.0
1.9%
Commentary
• In August, Maui experienced a significant
economic disruption from wildfires
2024P
1.5%
7.4%
(0.1)%
3.9%
9,326.5
(0.9)%
- Tourism to the island may not fully recover
in the next several years
- Rebuilding of homes and businesses may
take many years
In the near-term, expect economic growth in
Hawaii to moderate as tourism and visitor arrivals
slowly rebound from the effects of the Maui
wildfires
Matson.View entire presentation