Grab Results Presentation Deck
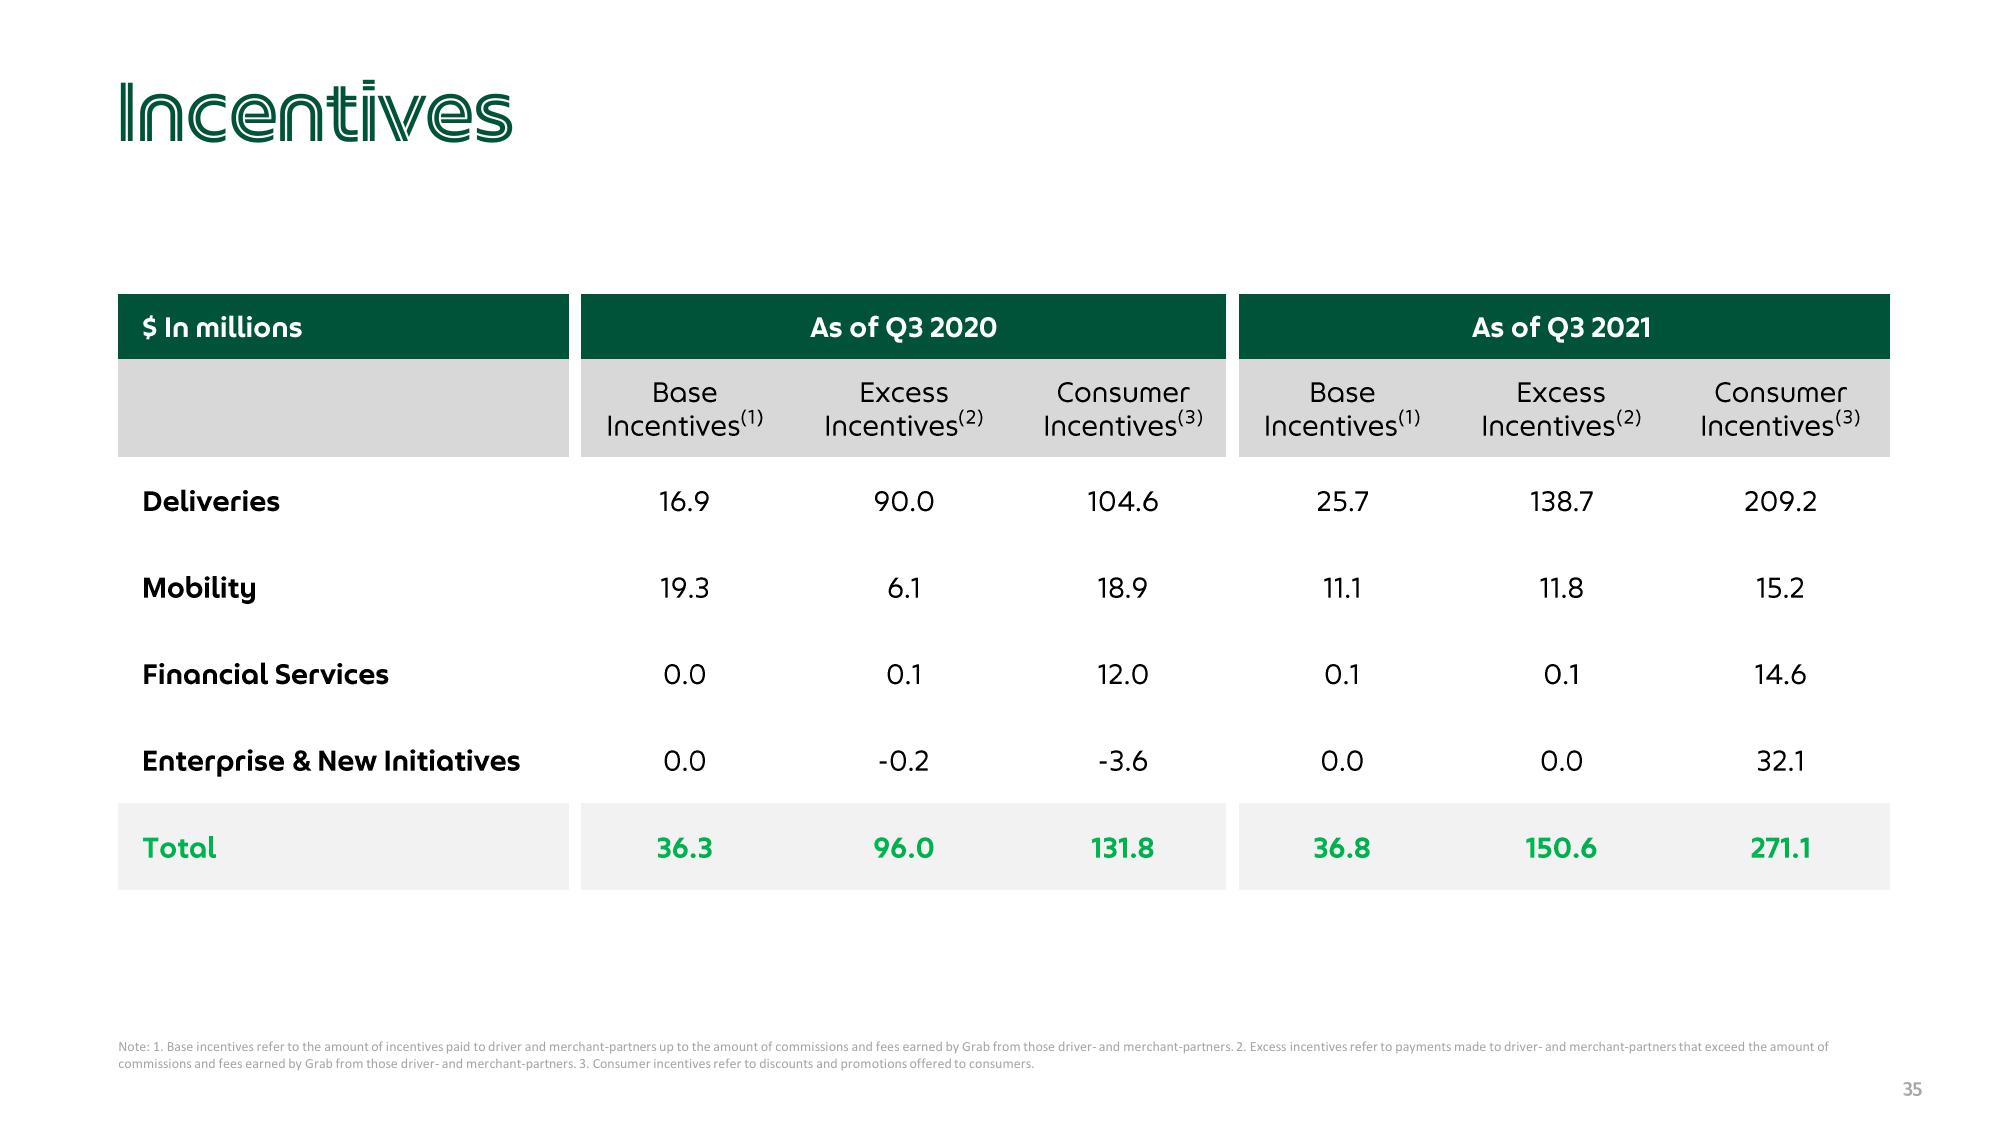
Incentives
$ In millions
Deliveries
Mobility
Financial Services
Enterprise & New Initiatives
Total
Base
Incentives (¹)
16.9
19.3
0.0
0.0
36.3
As of Q3 2020
Excess
Incentives (2)
90.0
6.1
0.1
-0.2
96.0
Consumer
Incentives (3)
104.6
18.9
12.0
-3.6
131.8
Base
Incentives (¹)
25.7
11.1
0.1
0.0
36.8
As of Q3 2021
Excess
Incentives (2)
138.7
11.8
0.1
0.0
150.6
Consumer
Incentives (3)
209.2
15.2
14.6
32.1
271.1
Note: 1. Base incentives refer to the amount of incentives paid to driver and merchant-partners up to the amount of commissions and fees earned by Grab from those driver- and merchant-partners. 2. Excess incentives refer to payments made to driver- and merchant-partners that exceed the amount of
commissions and fees earned by Grab from those driver- and merchant-partners. 3. Consumer incentives refer to discounts and promotions offered to consumers.
35View entire presentation