Apollo Global Management Investor Presentation Deck
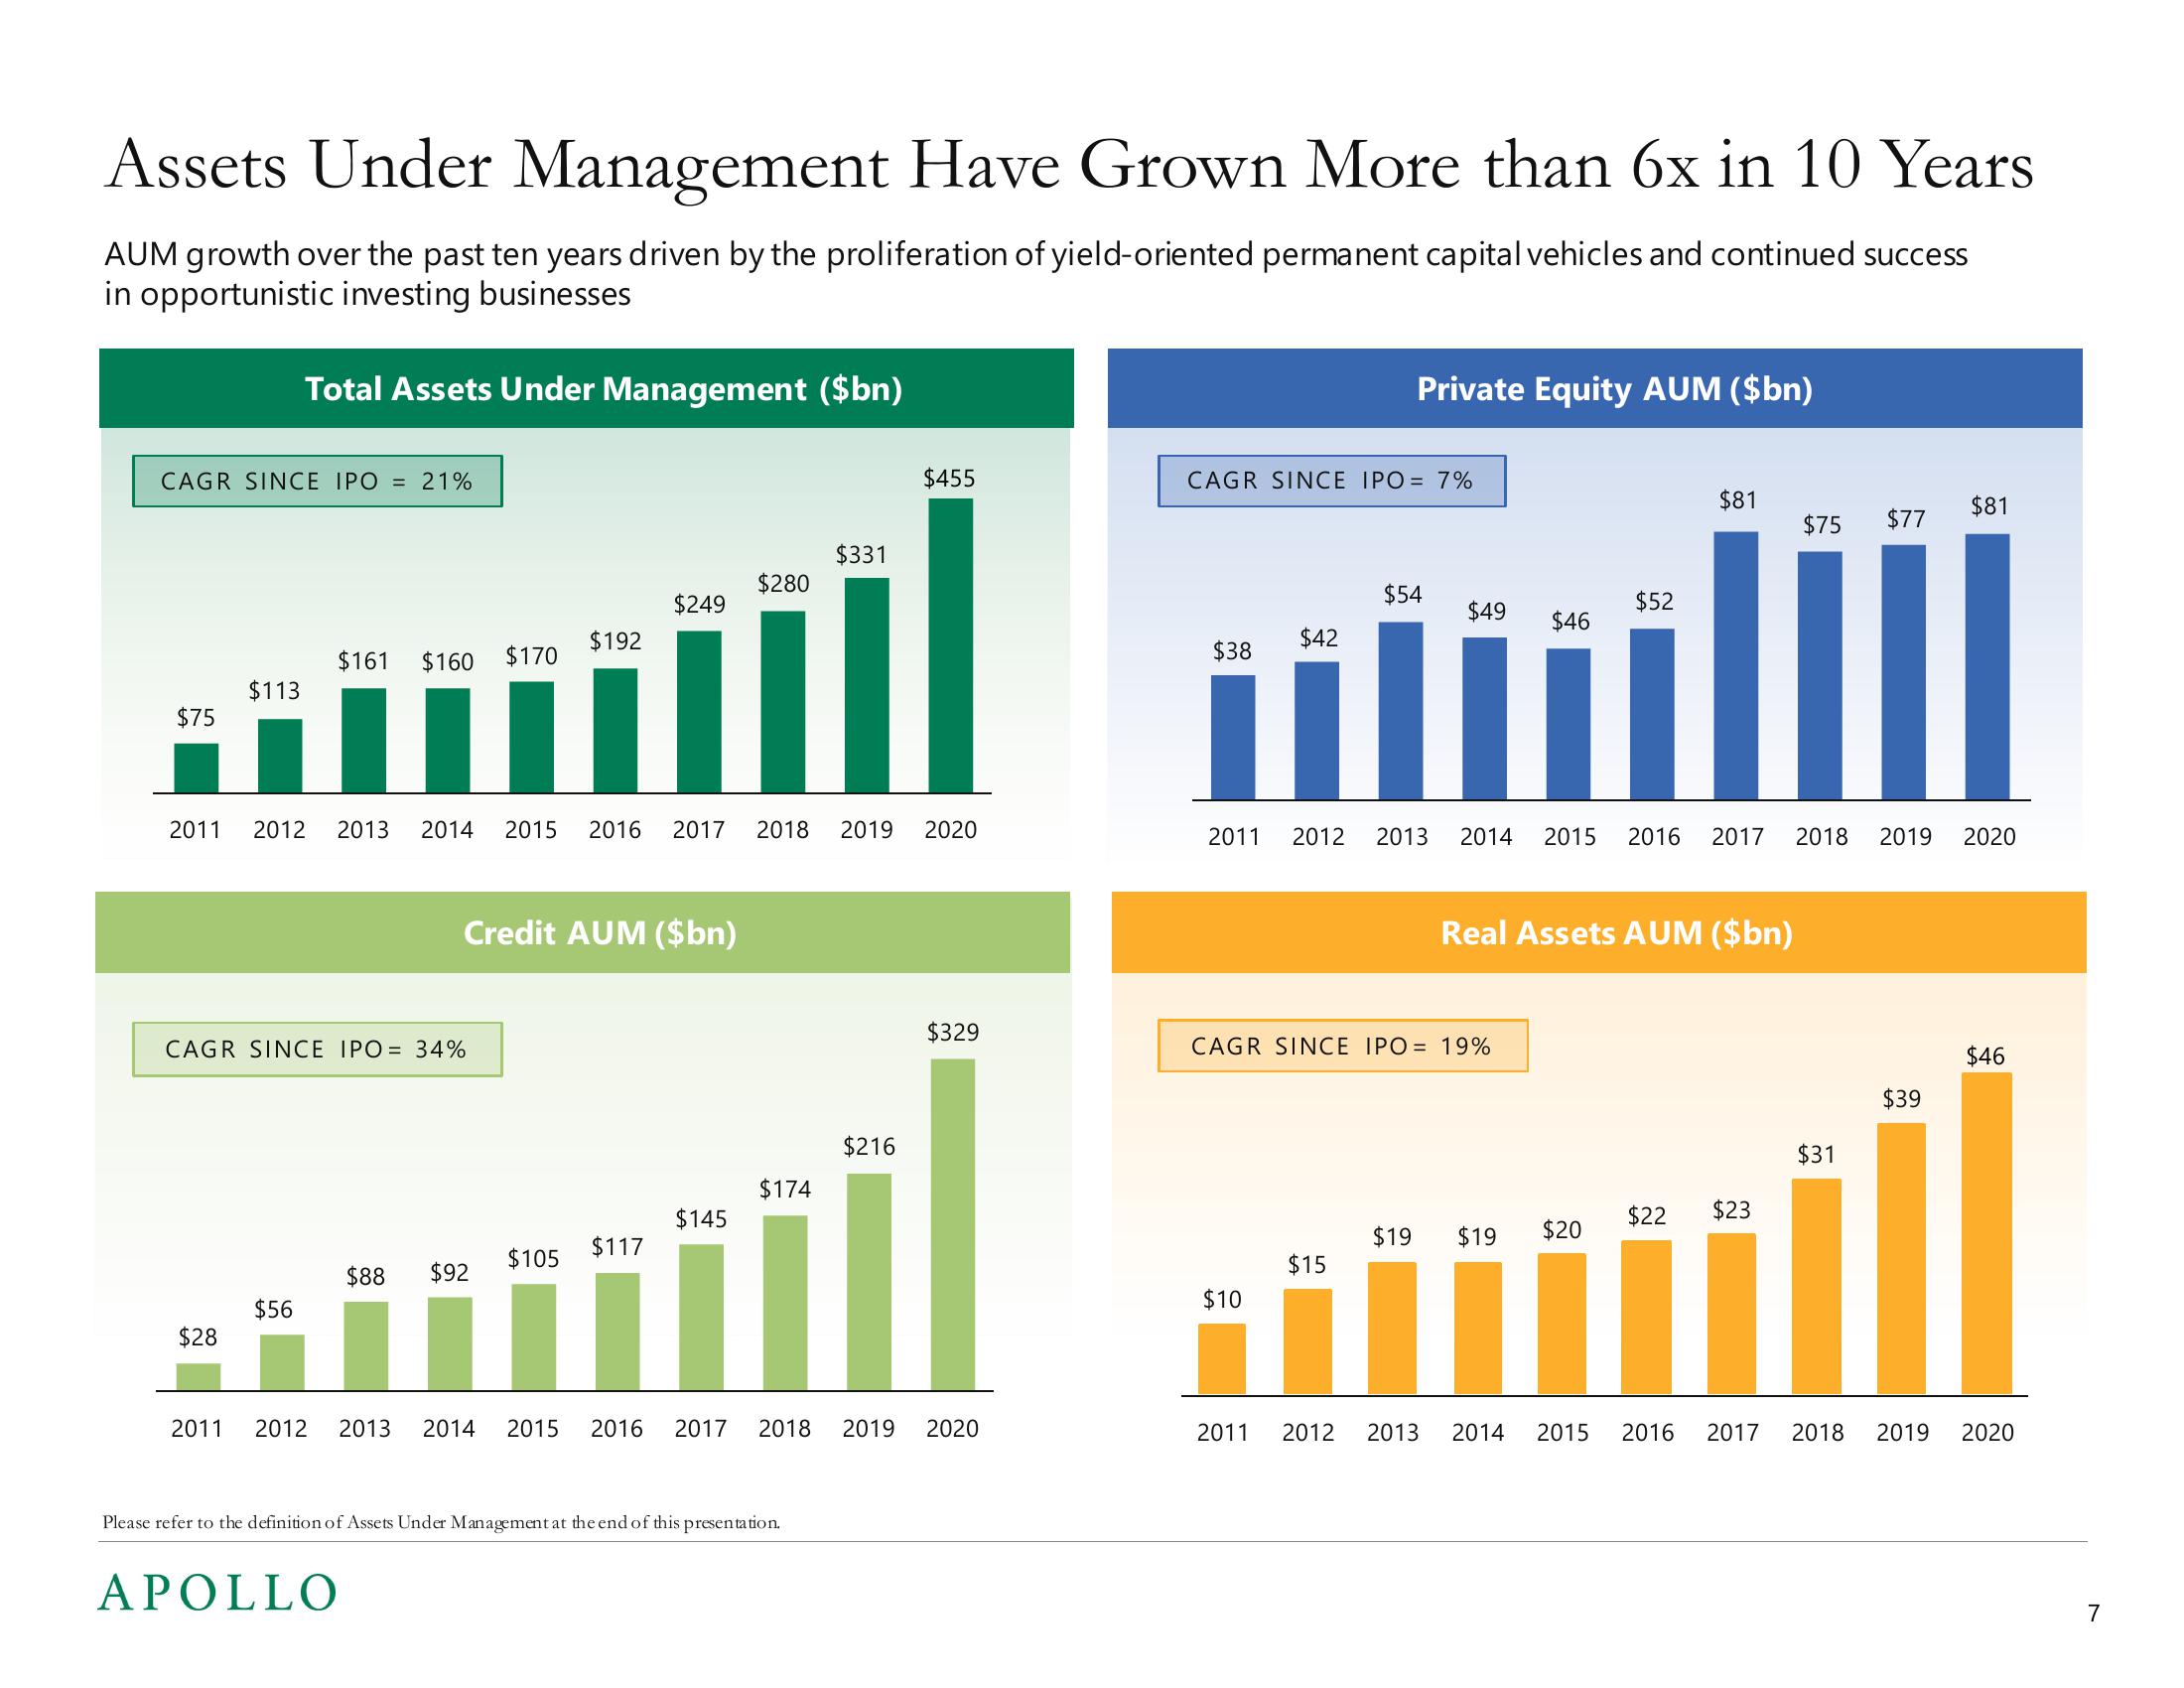
Assets Under Management Have Grown More than 6x in 10 Years
AUM growth over the past ten years driven by the proliferation of yield-oriented permanent capital vehicles and continued success
in opportunistic investing businesses
Total Assets Under Management ($bn)
CAGR SINCE IPO = 21%
$75
$113
$28
$161 $160 $170
CAGR SINCE IPO = 34%
$56
2011 2012 2013 2014 2015 2016 2017 2018 2019 2020
APOLLO
$192
Credit AUM ($bn)
$88 $92
$105
$249
$117
$280
$145
$174
$331
Please refer to the definition of Assets Under Management at the end of this presentation.
$455
$216
2011 2012 2013 2014 2015 2016 2017 2018 2019 2020
$329
CAGR SINCE IPO = 7%
$38
$42
Private Equity AUM ($bn)
$10
$54
$15
$49 $46
CAGR SINCE IPO = 19%
2011 2012 2013 2014 2015 2016 2017 2018
$52
Real Assets AUM ($bn)
$19 $19 $20
$81
2011 2012 2013 2014 2015
$22 $23
111
2016
$75
$31
$77
$81
2019 2020
$39
$46
2017 2018 2019 2020
7View entire presentation