Kore Results Presentation Deck
Summary - Q2 2023 Earnings & 2023 Outlook
KORE
8
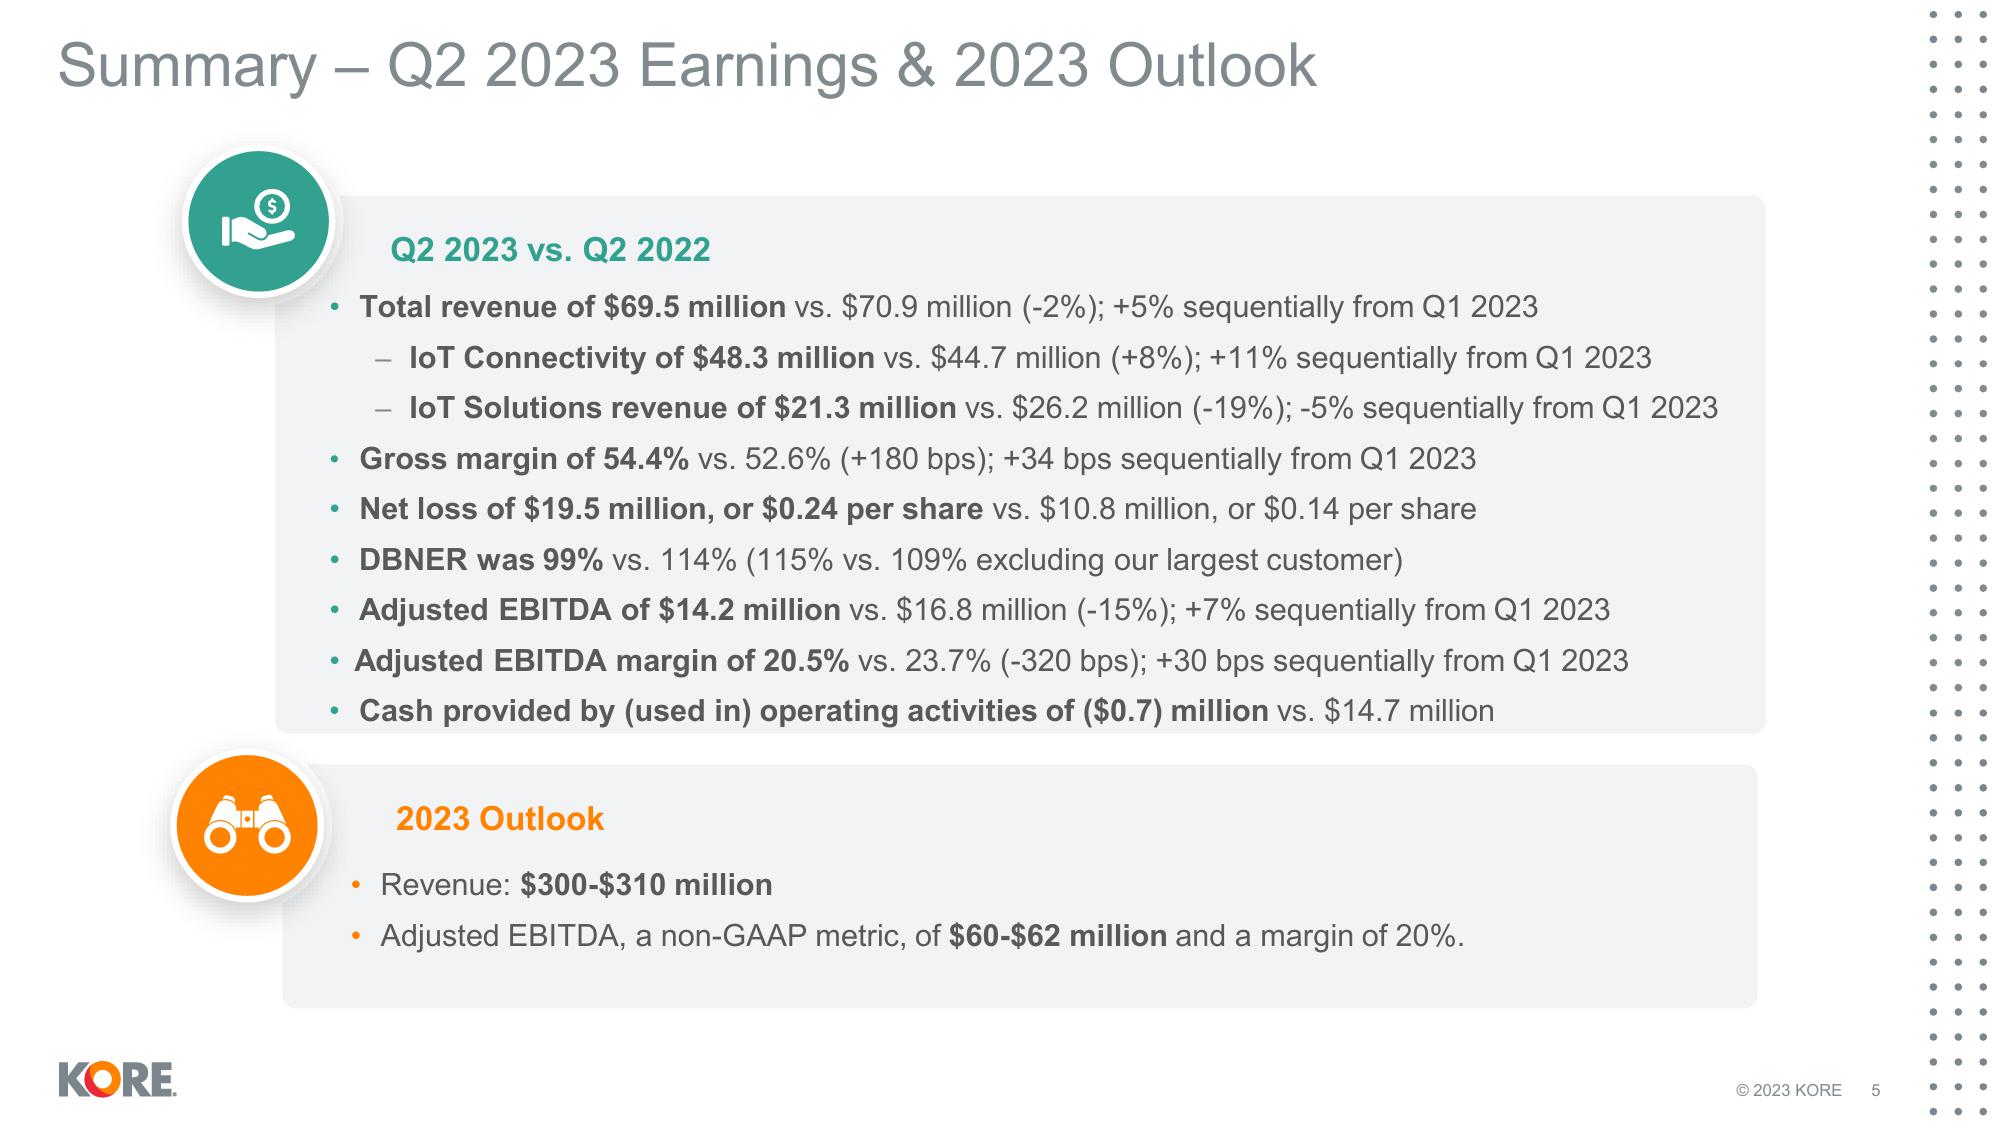
Q2 2023 vs. Q2 2022
Total revenue of $69.5 million vs. $70.9 million (-2%); +5% sequentially from Q1 2023
IoT Connectivity of $48.3 million vs. $44.7 million (+8%); +11% sequentially from Q1 2023
loT Solutions revenue of $21.3 million vs. $26.2 million (-19%); -5% sequentially from Q1 2023
Gross margin of 54.4% vs. 52.6% (+180 bps); +34 bps sequentially from Q1 2023
• Net loss of $19.5 million, or $0.24 per share vs. $10.8 million, or $0.14 per share
DBNER was 99% vs. 114% (115% vs. 109% excluding our largest customer)
Adjusted EBITDA of $14.2 million vs. $16.8 million (-15%); +7% sequentially from Q1 2023
Adjusted EBITDA margin of 20.5% vs. 23.7% (-320 bps); +30 bps sequentially from Q1 2023
Cash provided by (used in) operating activities of ($0.7) million vs. $14.7 million
●
●
●
●
●
2023 Outlook
Revenue: $300-$310 million
Adjusted EBITDA, a non-GAAP metric, of $60-$62 million and a margin of 20%.
© 2023 KORE 5
●
●
●
●
●
●
●
●
●
..
●
●●
●
●
●
●
●
.
● ●
●
●
●
●
● ●
●
●
•
● ●
...
●
e
●View entire presentation