Q2 Quarter 2023
Noninterest Expense
% Change vs
$ in millions
Q2 23
Q123
Q2 22
Q1 23
Q222
Salaries and employee benefits
$74.7
$77.0
$74.1
(3) %
1 %
Occupancy expense, net
11.4
11.6
11.0
(1)
4
Furniture and equipment
5.1
5.1
5.1
2
Deposit insurance
5.2
4.9
2.8
6
85
OREO and foreclosure expense
0.3
0.2
0.1
55
104
Other
42.9
43.1
44.5
(4)
Merger related costs
0.0
1.4
19.1
(99)
(100)
Total noninterest expense
$139.7
$143.2
$156.8
(2) %
(11) %
Adjusted noninterest expense¹
$136.0
$140.9
$135.7
(3) %
-
%
Noninterest Expense as a Percentage of
Total Average Assets
2.34%
Efficiency Ratio
67.8%
Employees (FTE)
Q2 23 Highlights
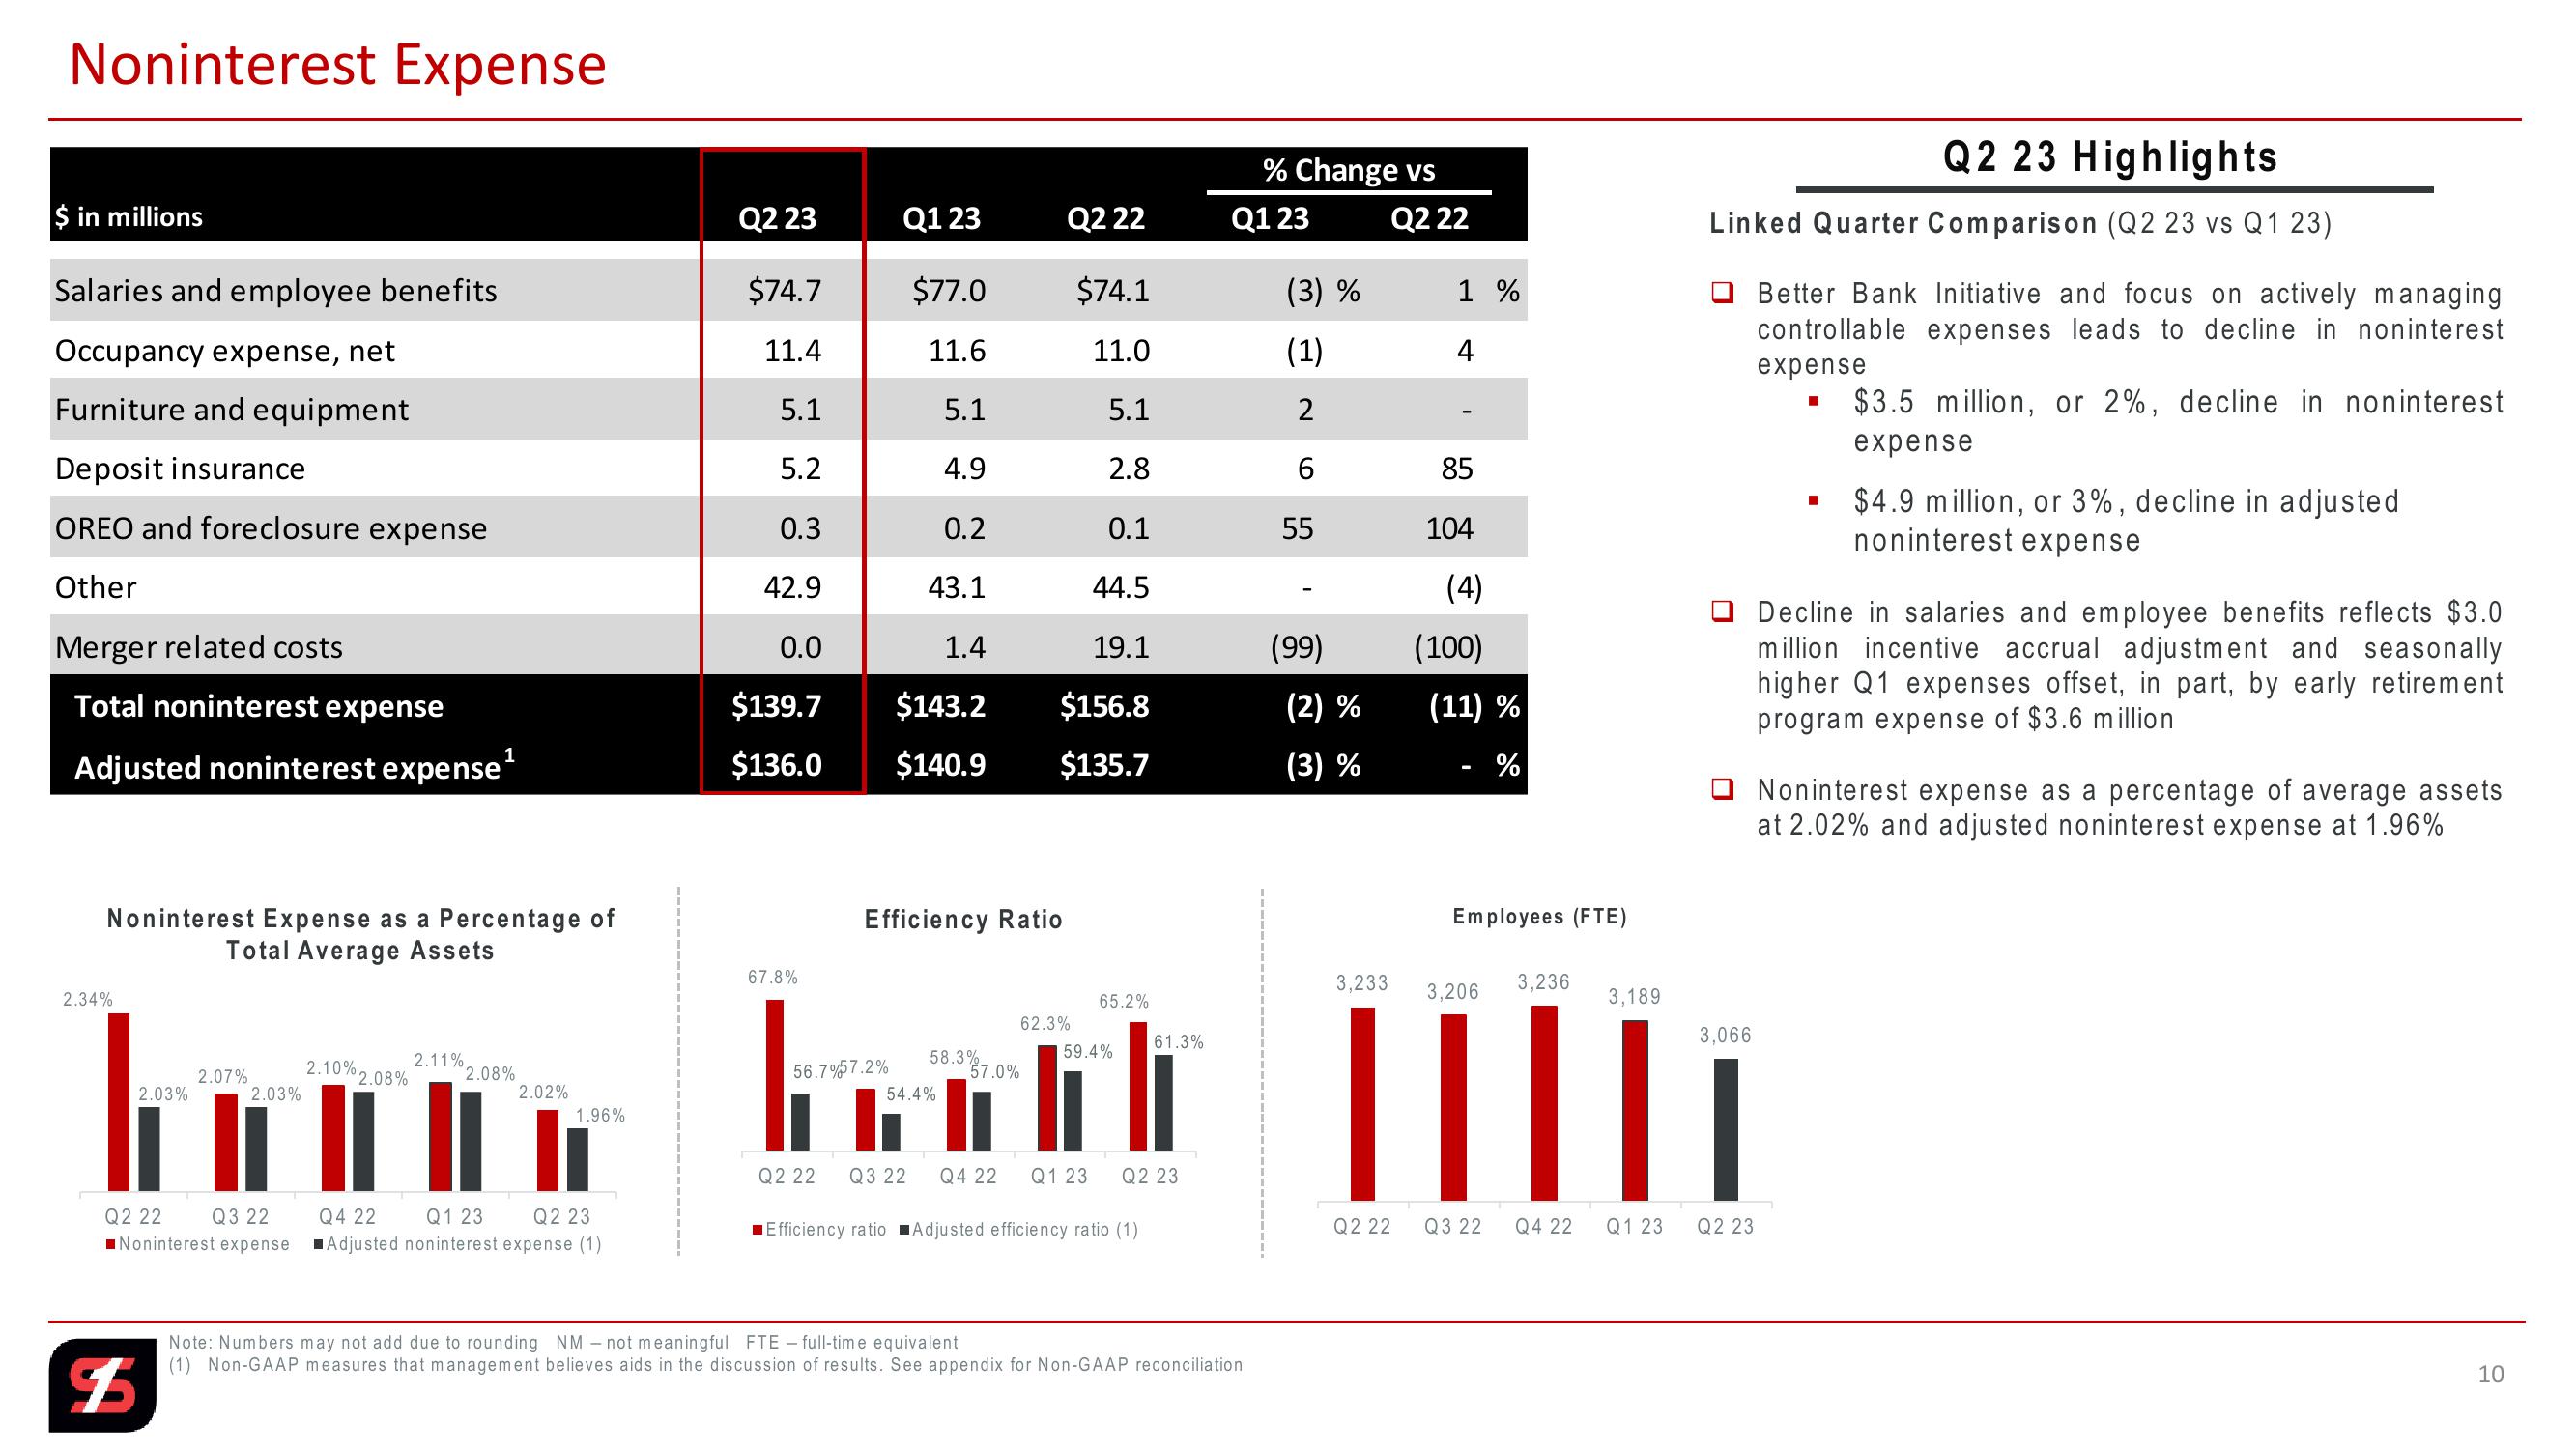
Linked Quarter Comparison (Q2 23 vs Q1 23)
Better Bank Initiative and focus on actively managing
controllable expenses leads to decline in noninterest
expense
$3.5 million, or 2%, decline in noninterest
expense
$4.9 million, or 3%, decline in adjusted
noninterest expense
Decline in salaries and employee benefits reflects $3.0
million incentive accrual adjustment and seasonally
higher Q1 expenses offset, in part, by early retirement
program expense of $3.6 million
Noninterest expense as a percentage of average assets
at 2.02% and adjusted noninterest expense at 1.96%
3,233
3,236
3,206
3,189
65.2%
62.3%
61.3%
2.10%
2.11%
2.07%
°2.08%
2.08%
2.03%
2.03%
2.02%
1.96%
56.7% 57.2%
58.3% 7.0%
59.4%
54.4%
Q2 22
Q3 22
Noninterest expense
Q2 22 Q3 22
Q4 22 Q1 23 Q2 23
Q4 22
Q1 23
Q2 23
■Efficiency ratio Adjusted efficiency ratio (1)
Q2 22
Q3 22
■Adjusted noninterest expense (1)
3.066
IIIII
Q4 22 Q1 23
Q2 23
Note: Numbers may not add due to rounding NM - not meaningful FTE -full-time equivalent
$5
(1) Non-GAAP measures that management believes aids in the discussion of results. See appendix for Non-GAAP reconciliation
10
10View entire presentation